Download
1 / 25
290 likes | 2.66k Views
Information graphics or infographics are graphic visual representations of information, data or knowledge. These graphics present complex information quickly and clearly, such as in signs, maps, journalism, technical writing, and education. With an information graphic, computer scientists, mathematicians, and statisticians develop and communicate concepts using a single symbol to process information.

E N D
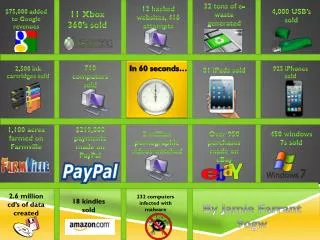
All about INFOGRAPHICS in 99 99 seconds! ‘0’ sec ‘99’ sec
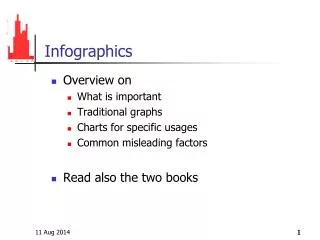
SO BASICALLY WHAT ARE INFOGRAPHICS
INFOGRAPHICS GRAPHICS INFORMATION PROCESS DATA TIMELINE RELATIONSHIP CHARTS DIAGRAMS IMAGES GRAPHS
EXAMPLES Click to see these in full length
WHY ARE INFOGRAPHICS DOMINATING
IT HAS THE POWER OF VISUAL STORYTELLING
FOR BUSINESS FOR EDUCATION
FOR BUSINESS FOR EDUCATION FOR START UPS
FOR BUSINESS FOR EDUCATION FOR START UPS FOR NON PROFITS
FOR BUSINESS FOR EDUCATION FOR START UPS FOR NON PROFITS FOR EVERYTHING Well yeah!! Almost for everything
HOW ARE INFOGRAPHICS DOING IT!!
THROUGH THE POWER OF CLARITY, PRECISION & EFFICIENCY
PEOPLE RETAIN 80% OF WHAT THEY SEE 20% 10% OF WHAT THEY READ OF WHAT THEY LISTEN
VISUALS ARE PROCESSED 60,000 TIMES FASTER THAN TEXT
94% MORE TOTAL VIEWS CONTENT WITH VISUALS GETS
THAT’S WHY INFOGRAPHICS ARE EASILY UNDERSTOOD HIGHLY ENGAGING INSTANTLY SHARED PERFECTLY MEMORIZED Well yeah!! Instant winner
IS IT POSSIBLE FOR ME TO MAKE ONE!! You’ll be able to make one within the next 3 3minutes
THESE ARE CREATED WITH OR PHOTOSHOP POWERPOINT
THESE ARE CREATED WITH OR PHOTOSHOP POWERPOINT I bet you know this!! and it’s as easy as making a slide
STEP TWO STEP ONE OPEN POWERPOINT AND GO TO DESIGN GO TO SLIDE SIZE AND SELECT CUSTOM SLIDE SIZE
STEP FOUR STEP THREE CHANGE THE WIDTH AND HEIGHT AS PER REQUIREMENT YOU’LL GET THE CANVAS (Blank slide) FOR YOUR INFOGRAPHIC
STEP SIX STEP FIVE DESIGN THE BLANK SLIDE WITH GRAPHS, CHARTS, IMAGES ETC EXPORT THE PRESENTATION TO PDF FORMAT
AND THERE YOU GO… AWESOMENESS UNLOCKED Use it, share it, like it, love it
FOR INSPIRATION CLICK ANY OF THESE BUTTONS