Download
1 / 1
10 likes | 137 Views
Jan. July. k. aerosol. Evaluation and Intercomparison of N 2 O 5 Chemistry in Two Versions of CMAQ. Chao-Jung Chien, Gail S. Tonnesen, Bo Wang, Zion S. Wang and Mohammad Omary. OVERVIEW

E N D
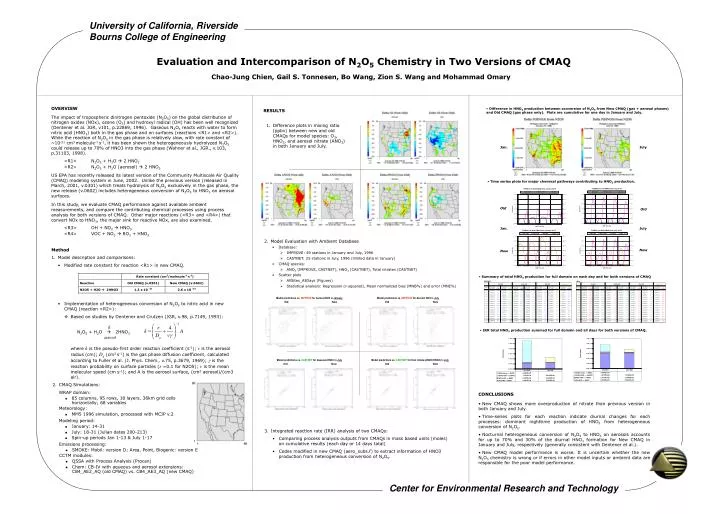
Jan. July k aerosol Evaluation and Intercomparison of N2O5 Chemistry in Two Versions of CMAQ Chao-Jung Chien, Gail S. Tonnesen, Bo Wang, Zion S. Wang and Mohammad Omary • OVERVIEW • The impact of tropospheric dinitrogen pentoxide (N2O5) on the global distribution of nitrogen oxides (NOx), ozone (O3) and hydroxyl radical (OH) has been well recognized (Dentener et al. JGR, v101, p.22869, 1996). Gaseous N2O5 reacts with water to form nitric acid (HNO3) both in the gas phase and on surfaces (reactions <R1> and <R2>). While the reaction of N2O5 in the gas phase is relatively slow, with rate constant of ~10-21 cm3 molecule-1 s-1, it has been shown the heterogeneously hydrolyzed N2O5 could release up to 70% of HNO3 into the gas phase (Wahner et al., JGR., v.103, p.31103, 1998). • <R1> N2O5 + H2O 2 HNO3 • <R2> N2O5 + H2O (aerosol) 2 HNO3 • US EPA has recently released its latest version of the Community Multiscale Air Quality (CMAQ) modeling system in June, 2002. Unlike the previous version (released in March, 2001, v.0301) which treats hydrolysis of N2O5 exclusively in the gas phase, the new release (v.0602) includes heterogeneous conversion of N2O5 to HNO3 on aerosol surfaces. • In this study, we evaluate CMAQ performance against available ambient measurements, and compare the contributing chemical processes using process analysis for both versions of CMAQ. Other major reactions (<R3> and <R4>) that convert NOx to HNO3, the major sink for reactive NOx, are also examined. • <R3> OH + NO2 HNO3 • <R4> VOC + NO3 RO2 + HNO3 RESULTS • Difference in HNO3 production between conversion of N2O5 from New CMAQ (gas + aerosol phases) and Old CMAQ (gas phase only). Plots are cumulative for one day in January and July. • Difference plots in mixing ratio (ppbv) between new and old CMAQs for model species: O3, HNO3, and aerosol nitrate (ANO3) in both January and July. Jan. July • Time series plots for major chemical pathways contributing to HNO3 production. Old Old • Model Evaluation with Ambient Database • Database: • IMPROVE: 49 stations in January and July, 1996 • CASTNET: 25 stations in July, 1996 (limited data in January) • CMAQ species: • ANO3 (IMPROVE, CASTNET), HNO3 (CASTNET), Total nitrates (CASTNET) • Scatter plots • AllSites_AllDays (Figures) • Statistical analysis: Regression (r-squared), Mean normalized bias (MNB%) and error (MNE%) • Method • Model description and comparisons: • Modified rate constant for reaction <R1> in new CMAQ. • Implementation of heterogeneous conversion of N2O5 to nitric acid in new CMAQ (reaction <R2>): • Based on studies by Dentener and Crutzen (JGR, v.98, p.7149, 1993): • N2O5 + H2O 2HNO3 • where k is the pseudo-first order reaction coefficient (s-1); r is the aerosol radius (cm); Dg (cm2 s-1) is the gas phase diffusion coefficient, calculated according to Fuller et al. (J. Phys. Chem., v.75, p.3679, 1969); is the reaction probability on surface particles (r =0.1 for N2O5); v is the mean molecular speed (cm s-1); and A is the aerosol surface, (cm2 aerosol)/(cm3 air). New New • Summary of total HNO3 production for full domain on each day and for both versions of CMAQ Model predictions vs. IMPROVE for Aerosol NO3 in January Model predictions vs. IMPROVE for Aerosol NO3 in July • IRR total HNO3 production summed for full domain and all days for both versions of CMAQ. Model predictions vs. CASTNET for Gaseous HNO3 in July Model predictions vs. CASTNET for total nitrate (ANO3+HNO3) in July • CMAQ Simulations: • WRAP domain: • 85 columns, 95 rows, 18 layers, 36km grid cells horizontally; 68 variables Meteorology: • MM5 1996 simulation, processed with MCIP v.2 Modeling period: • January: 14-31 • July: 18-31 (Julian dates 200-213) • Spin-up periods Jan 1-13 & July 1-17 • CONCLUSIONS • New CMAQ shows more overproduction of nitrate than previous version in both January and July. • Time-series plots for each reaction indicate diurnal changes for each processes: dominant nighttime production of HNO3 from heterogeneous conversion of N2O5. • Nocturnal heterogeneous conversion of N2O5 to HNO3 on aerosols accounts for up to 70% and 30% of the diurnal HNO3 formation for New CMAQ in January and July, respectively (generally consistent with Dentener et al.). • New CMAQ model performance is worse. It is uncertain whether the new N2O5 chemistry is wrong or if errors in other model inputs or ambient data are responsible for the poor model performance. • Integrated reaction rate (IRR) analysis of two CMAQs: • Comparing process analysis outputs from CMAQs in mass based units (moles) on cumulative results (each day or 14 days total) • Codes modified in new CMAQ (aero_subs.f) to extract information of HNO3 production from heterogeneous conversion of N2O5. Emissions processing: • SMOKE: Mobil: version D; Area, Point, Biogenic: version E CCTM modules: • QSSA with Process Analysis (Procan) • Chem: CB-IV with aqueous and aerosol extensions:CB4_AE2_AQ (old CMAQ) vs. CB4_AE3_AQ (new CMAQ)