Download
1 / 21
210 likes | 278 Views
Variability of Northern Hemisphere Spring Snowmelt Dates using the APP Snow Cover during 1982-2004 Hongxu Zhao Richard Fernandes C anada C entre for R emote S ensing Earth Sciences Sector Natural Resources Canada. Outline. Motivation x3 APP snow cover x3

E N D
Variability of Northern Hemisphere Spring Snowmelt Dates using the APP Snow Cover during 1982-2004 Hongxu Zhao Richard Fernandes Canada Centre for Remote Sensing Earth Sciences Sector Natural Resources Canada
Outline Motivation x3 APP snow cover x3 Variations of Snowmelt date (Smtd)x3 Temperature sensitivity regions and SAFx3
Motivation__objectives Can we constrain the spread of climate models using satellite observed snow-albedo feedback (SAF)? Recent studies have shown that there was a large spread in the current generation of climate models in temperature response over NH to the anthropogenic forcing. It has been identified that the strength of SAF accounts for a three fold spread of the intermodel divergence (Hall and Qu 2006).
The global climate of the 21st century b. Temperature change(IPCC AR3) a. Temperature change (IPCC AR3) c. Arctic sea ice extent change(Boé et al 2009) “All models are wrong, some are useful” said the famous statistician George Box.
Snow albedo feedback (SAF) Qu&Hall2007 calculated the two terms based on outputs of 17 climate models used in IPCC AR4, Atmospheric term: All models agree each other to within 10%. The models also agree with an observational estimate from International Satellite Cloud Climatology Project (ISCCP) data (horizontal line). Surface term: It exhibits a three-fold spread in these models. This term is main source of the divergence in simulations of SAF. Following Qu & Hall (2006, 2007), Soden & Held (2006), Cess & Potter (1988), the strength of SAF can be determined by the product of two terms: 1) the dependence ofplanetary albedo on surface albedo 2) change in surface albedo induced by a unit surface air temperature change. Atmospheric term Atmospheric term Surface term Surface term Where Q (constant) and Qnet are the incoming and net shortwave radiation at TOA, αs is the surface albedo, and αpis the planetary albedo.
Motivation__objectives Can we constrain the spread of climate models using satellite observed snow-albedo feedback (SAF)? Recent studies have shown that there was a large spread in the current generation of climate models in temperature response over NH to the anthropogenic forcing. It has been identified that the strength of SAF accounts for a three fold spread of the intermodel divergence (Hall and Qu 2006). Motivation__ Data limitation Current in-situ snow cover datasets have limited spatial coverage while satellite-based snow cover records have either limited historical extent (e.g. MODIS) or limited temporal and spatial resolution (e.g., NOAA weekly snow cover, Robinson, 2000) constrained by clouds, specific sensor availability, or processing methodology.
How to constrain GCM models in transient climate process with limited observational records? Answer: Using Seasonal cycle to simulate climate change (Hall&Qu2006) Hall and Qu (2006) show that intermodel variations in SAF in the seasonal cycle are highly correlated with those in climate change. Hence, the SAF based on the present-day seasonal cycle are excellent predictors of the SAF in climate change. Spring SAF values in climate change (22nd-centery-mean minus 20th-centery-measn) vs. in 20th centery mean seasonal cycle (from April to May) averaged over NH continents polarward of 30deg.The observed value (-1.1) is based on ISCCP and ERA40. The most complicated models -1.1
APP snow A Daily 5km snow cover product extracted from AVHRR Polar Pathfinder (APP) data (APP snow) Based on a new snow mapping algorithm, we have produced the new daily 5km APP snow cover (Zhao and Fernandes, 2009 JGR), including during cloudy conditions, over Northern Hemisphere land surfaces over 1982-2004. The APP snow cover maps showed an 85% agreement rate or better at 95% of the in-situ sites (at a comparable level of agreement to in-situ snow cover for MODIS equivalent 0.05 degree snow cover estimates). The almost continuous spatial and temporal coverage ability of the APP snow product will benefit estimations of spring snowmelt dates and snow albedo feedback over northern circumpolar regions. Albedo-x product: Wang and Key (2005) developed all sky APP extended daily albedo product over the same period of time on a sampled 25km resolution. Temperature datasets: ERA40 and NCEP reanalysis surface air temperature
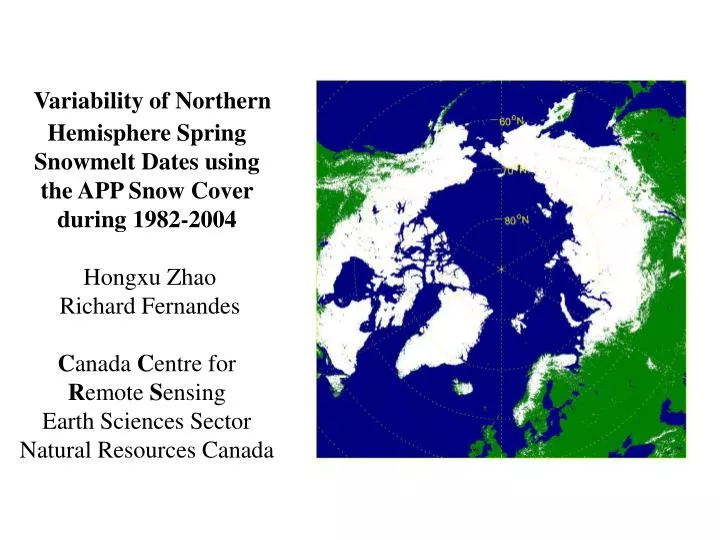
APP snow Almost continuous spatial coverage of the APP snow maps White=snow; Green=land; Black=not available; Blue=water.
Smtd variability Mean Smtd (unit: DOY) Standard deviations Spring snowmelt dates generally increase with latitude consistent with the seasonal march of solar radiation during spring and early summer in the Northern Hemisphere, with clearly topographically dependent features associated with delayed melt dates over mountains areas.
Smtd variability Figure 2. The time series of Smtd averaged over a) the northern Eurasia (EA, solid) and North America (NA, dashed). ► The continental snowmelt dates do not show negative trends as expected rather than statistically insignificant positive trends with strong interannual variability superimposed over the period of 1982-2004. Since 1998, the snowmelt dates seem to diverge between the two continents. 70-80N 60-70N 50-60N
Smtd variability Melting season temperature strongly correlated to Smtd Surface atmospheric circulations exert influence on Continental Smtd
Smtd variability Leading atmospheric teleconnection modes drive interannual variability of Smtd by temperature
Approach 2 K4-1 = k3+K2·k1(1) where k1 and k4 can determined by observations, k3 and k2 are unknown terms. K2 can be estimated based on following approximation (Qu and Hall, 2007): K2=1/2·(αfsnow + αpsnow )- αland(2)(contrast btw snow albedo & snow-free land albedo) Where αsnowandαlandare the surface albedo of snow covered and snow-free surfaces respectively; superscripts “f” and “p” correspond to future and present climate or month; αlandis determined by the average for the first 30 snow-free dates after the snowmelt dates. Effective snow albedo (completely snow-covered surface): αisnow ={ αis -(1-Sic) αland}/Sic(3) Where Sc is snow cover fraction. Once K2 is known, K3 can be estimated by rearranging Eq. (1) k3= K4-1 - k1·k2(4)
Spatial patterns of SAF factors & Spatial correlations K4-1 = K2·k1+k3 0.20 (0.72) 0.75 (0.64) K4-1 K1k2 K3 0.91 (0.63) -0.07 (-0.23) 0.70 (0.38) K1 K2 -0.38 (-0.06) Contribution to SAF mainly comes from k1k2, but k3 over Eurasia is relatively larger. Furthermore, K1 contributes mainly to k1k2, opposite to Qu&Hall2007 that k2 is key factor to SAF using GCMs.
Our observational study Qu and Hall (2007) Controls of snow albedo feedback SAF= k4-1= K2·k1+K3 Causes of spread in models: SAF= k4-1= K2·k1+K3 K1 k3 Spatial CC(NH/NA,EA) K2 (=0.27±0.02) K2·k1= -0.66±0.07 Qu and Hall (2007) Qu and Hall (2007)
Summary of the preliminary studyand future studies 1. Using the APP snow and albedo datasets, as well as ERA40, we have obtained spatial patterns and NH averaged quantities of the snow albedo feedback parameters. The NH averaged k4-1 is close to ISCCP. • The spatial pattern of SAF (=k4-1 ) is mainly explained by the pattern of the snow cover component k1·k2 (>60%, same as model simulations) but both snow cover and metamorphosis components contribute to k4-1 over Eurasia. The latterfinding suggests that anthropogenic deposition of pollution on central Eurasian snow-covered surfaces may explain the distinction between the two continents (Flanner et al. 2008, Atmos. Chem. Phys. Discuss). (c. Black Carbon effects on SAF over Eurasia.) • K4-1,k3, k1k2, & k2 showed low levels of interannual variability, while k1 is sensitive to internal climate variability (Groismnan et al 1994).Nevertheless, all of the SAF components and factors are useful for identifying GCMs that exceed the range of observations and therefore provide constrains to these models? (b. Is it fair to use a SAF control factor that has strong interannual variability?)
Motivation Snow Albedo Feedback (SAF) Can we constrain the spread of GCMs using satellite observed snow-albedo feedback (SAF)? 1. New snow cover and surface albedo products have been developed recently (Zhao&Fernandes2009; Wang&Key2005) 2. Quantifying control factors of SAF using satellite observations 3. (future) How to constrain these spreads in models? a. Present seasonal cycle SAF can be used to compare transient climate so as to constrain intermodel spread (Hall&Qu2006). How about other SAF control factors, say k1, k2, k3, k1·k2? Modelling research b. Is it fair to use a SAF control factor that has strong interannual variability? Combined observational rand modelling research c. Black Carbon effects on SAF over Eurasia. Observations with model BC
Constrain GCMs using observations Observational and model based estimates of mean NH surface albedo feedback sensitivity and control parameters between 1982-1999. Shaded regions correspond to 95% confidence interval of observational estimate.


