Download
1 / 1
10 likes | 126 Views
Hilic-Ms : from targeted to untargeted. Narduzzi Luca, Arapitsas Panagiotis , Della Corte Anna, Angeli Andrea, Mattivi Fulvio. Contact : luca.narduzzi@fmach.it. Research and Innovation Center, Fondazione Edmund Mach, Via E. Mach 1, San Michele all’Adige 38100 (TN) Italy .

E N D
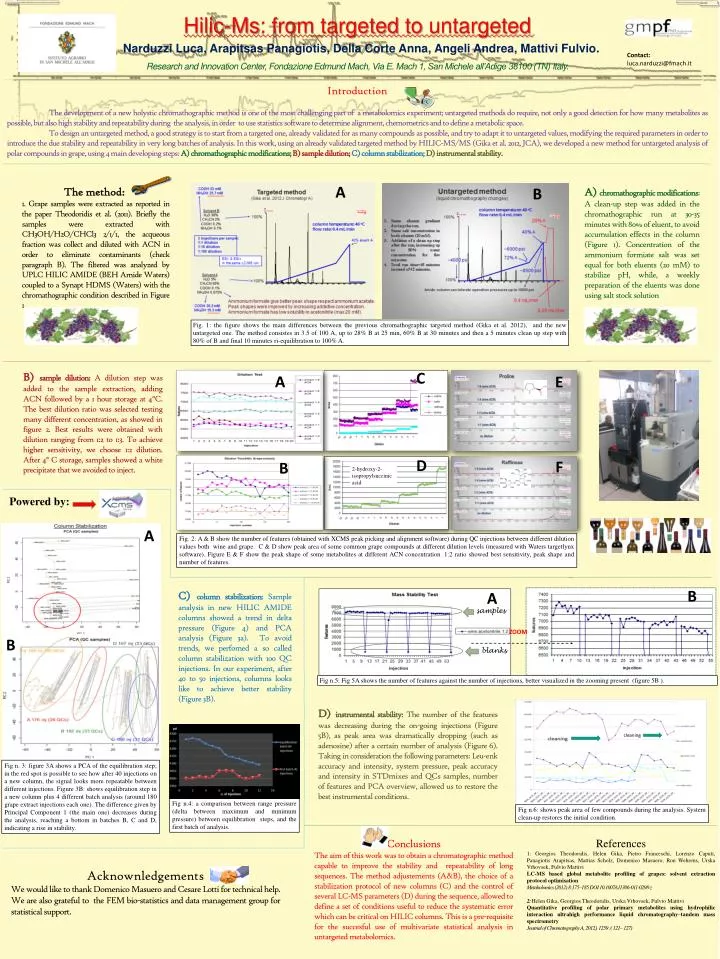
Hilic-Ms: from targeted to untargeted Narduzzi Luca, ArapitsasPanagiotis, Della Corte Anna, Angeli Andrea, Mattivi Fulvio. Contact: luca.narduzzi@fmach.it Research and Innovation Center, Fondazione Edmund Mach, Via E. Mach 1, San Michele all’Adige 38100 (TN) Italy. Introduction The development of a new holystic chromathographic method is one of the most challenging part of a metabolomics experiment; untargeted methods do require, not only a good detection for how many metabolites as possible, but also high stability and repeatability during the analysis, in order to use statistics software to determine alignment, chemometrics and to define a metabolic space. To design an untargeted method, a good strategy is to start from a targeted one, already validated for as many compounds as possible, and try to adapt it to untargeted values, modifying the required parameters in order to introduce the due stability and repeatability in very long batches of analysis. In this work, using an already validated targeted method by HILIC-MS/MS (Gika et al. 2012, JCA), we developed a new method for untargeted analysis of polar compounds in grape, using 4 main developing steps: A) chromathographic modifications;B) sample dilution; C) column stabilization; D) instrumental stability. A B The method: 1. Grape samples were extracted as reported in the paper Theodoridis et al. (2011). Briefly the samples were extracted with CH3OH/H2O/CHCl3 2/1/1, the acqueous fraction was collect and diluted with ACN in order to eliminate contaminants (check paragraph B). The filtered was analyzed by UPLC HILIC AMIDE (BEH Amide Waters) coupled to a Synapt HDMS (Waters) with the chromathographic condition described in Figure 1. • A) chromathographic modifications: A clean-up step was added in the chromathographic run at 30-35 minutes with 80% of eluent, to avoid accumulation effects in the column (Figure 1). Concentration of the ammonium formiate salt was set equal for both eluents (20 mM) to stabilize pH, while, a weekly preparation of the eluents was done using salt stock solution Fig. 1: the figure shows the maindifferencesbetween the previouschromathographictargetedmethod (Gika et al. 2012), and the new untargetedone. The methodconsistes in 3.5 of 100 A, up to 28% B at 25 min, 60% B at 30 minutes and then a 5 minutes clean up step with 80% of B and final 10 minutes ri-equilibration to 100% A. C • B) sample dilution: A dilution step was added to the sample extraction, adding ACN followed by a 1 hour storage at 4°C. The best dilution ratio was selected testing many different concentration, as showed in figure 2. Best results were obtained with dilution ranging from 1:2 to 1:3. To achieve higher sensitivity, we choose 1:2 dilution. After 4° C storage, samples showed a white precipitate that we avoided to inject. A E D F B 2-hydroxy-2-isopropylsuccinic acid Powered by: A Fig. 2: A & B show the number of features (obtained with XCMS peak picking and alignment software) during QC injections between different dilution values both wine and grape. C & D show peak area of some common grape compounds at different dilution levels (measured with Waters targetlynx software). Figure E & F show the peak shape of some metabolites at different ACN concentration. 1:2 ratio showed best sensitivity, peak shape and number of features. B A • C) column stabilization: Sample analysis in new HILIC AMIDE columns showed a trend in delta pressure (Figure 4) and PCA analysis (Figure 3a). To avoid trends, we perfomed a so called column stabilization with 100 QC injections. In our experiment, after 40 to 50 injections, columns looks like to achieve better stability (Figure 3B). samples ZOOM B blanks Fig n.5: Fig 5A shows the number of featuresagainst the number of injections, bettervisualized in the zoomingpresent (figure 5B ). D) instrumental stability: The number of the features was decreasing during the on-going injections (Figure 5B), as peak area was dramatically dropping (such as adenosine) after a certain number of analysis (Figure 6). Taking in consideration the following parameters: Leu-enk accuracy and intensity, system pressure, peak accuracy and intensity in STDmixes and QCs samples, number of features and PCA overview, allowed us to restore the best instrumental conditions. cleaning Fig n. 3: figure 3A shows a PCA of the equilibration step; in the red spot is possible to see how after 40 injections on a new column, the signal looks more repeatable between different injections. Figure 3B: shows equilibration step in a new column plus 4 different batch analysis (around 180 grape extract injections each one). The difference given by Principal Component 1 (the main one) decreases during the analysis, reaching a bottom in batches B, C and D, indicating a rise in stability. Fig n.4: a comparison between range pressure (delta between maximum and minimum pressure) between equilibration steps, and the first batch of analysis. Fig n.6: shows peak area of fewcompoundsduringthe analysis. System clean-up restores the initialcondition. Conclusions The aim of this work was to obtain a chromatographic method capable to improve the stability and repeatability of long sequences. The method adjustements (A&B), the choice of a stabilization protocol of new columns (C) and the control of several LC-MS parameters (D) during the sequence, allowed to define a set of conditions useful to reduce the systematic error which can be critical on HILIC columns. This is a pre-requisite for the succesful use of multivariate statistical analysis in untargeted metabolomics. References 1: Georgios Theodoridis, Helen Gika, Pietro Franceschi, Lorenzo Caputi, Panagiotis Arapitsas, Mattias Scholz, Domenico Masuero, Ron Wehrens, Urska Vrhovsek, Fulvio Mattivi LC-MS based global metabolite profiling of grapes: solvent extraction protocol optimisation Metabolomics (2012) 8:175–185 DOI 10.1007/s11306-011-0298-z 2: Helen Gika, Georgios Theodoridis, Urska Vrhovsek, Fulvio Mattivi Quantitative profiling of polar primary metabolites using hydrophilic interaction ultrahigh performance liquid chromatography–tandem mass spectrometry Journal of Chromatography A, 2012), 1259 :( 121– 127) Acknownledgements We would like to thank Domenico Masuero and Cesare Lotti for technical help. We are also grateful to the FEM bio-statistics and data management group for statistical support.