Download
1 / 24
240 likes | 399 Views
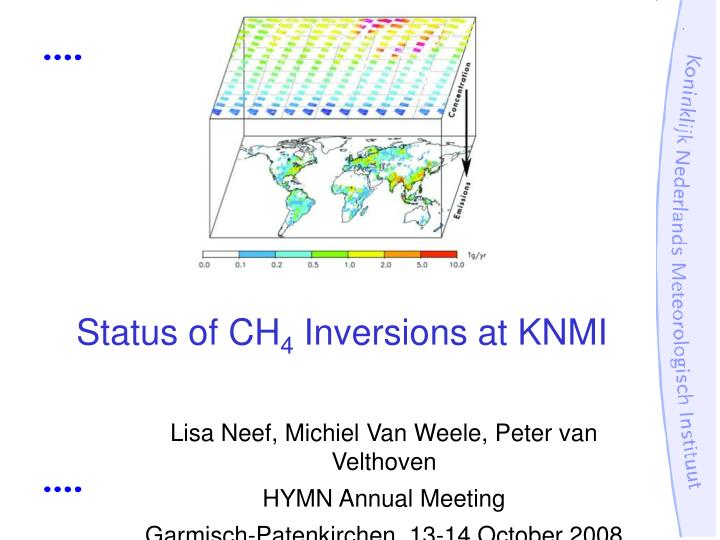
Lisa Neef, Michiel Van Weele, Peter van Velthoven HYMN Annual Meeting Garmisch-Patenkirchen, 13-14 October 2008. Status of CH 4 Inversions at KNMI. Overview. Protocol Inversion (comparison with Paris) Constraint from stable isotope observations Preliminary results from Forward Runs.

E N D
Lisa Neef, Michiel Van Weele, Peter van Velthoven HYMN Annual Meeting Garmisch-Patenkirchen, 13-14 October 2008 Status of CH4 Inversions at KNMI
Overview • Protocol Inversion (comparison with Paris) • Constraint from stable isotope observations • Preliminary results from Forward Runs
Inverse Modeling with 4D-Var and TM5 Minimize J with respect to x. x: CH4 emissions per gridcell, per month, per category y: Observations H A model to connect emissions to concentrations: TM5 B: covariance matrix: only spatial and temporal correlations are nonzero Figure by Jan Fokke Meirink
Ruminants3 (17%) [-62‰] Fossil Fuels3 (16%) [-40‰] Wetlands2 (32%) [-56‰] (this is Kaplan, not LPJ) Waste3 (12%) [-61‰] Rice3 (9%) [-63‰] Geo. Seepage4,5,6 (6%) [-40‰] • Distinguishable by: • Spatial distribution • Temporal variability • Isotopic Signature • The inversion takes into account only spatial and temporal variability BMB7 (3%) [-22‰] Termites8 (3%) [-57‰]
Protocol Inversion for Intercomparison How do the KNMI & LSCE inversion systems interpret the same set of observations? • Global total emission of 507 Tg CH4 • Year 2004 • 58 Ground-based observations • Assumed global error of 36.0 Tg CH4 Protocol KNMI 1-Cat Inversion: Solve for total CH4 emission per gridcell per month 11-Cat Inversion: Solve for CH4 emission per gridcell per process per month
KNMI Protocol Inversion: Convergence Gradient Reduction vs. 4D-Var Iteration
KNMI Protocol Inversion: Fit to Observations Improved fit to observations, similar for both methods. But: distinguishing categories makes it a bit harder to fit observations?
KNMI Protocol Inversion: Fit to Observations Alert Cape Grim Improving the overall fit means worsening the fit to some other stations. Mace Head
KNMI Protocol Inversion: Emission Increments total prior (Tg) 507.4 total posterior (Tg) 505.8 1-Category 11-Category total prior (Tg) 507.4 total posterior (Tg) 510.2 1. Shift from boreal to temperate North America 2. Decrease in temperate Eurasia 3. Decrease in Australia
KNMI Protocol Inversion: Increment per Region Distinguishing categories has the most impact when the analysis increment is large.
KNMI Protocol Inversion: Increment per Category Fit to observations can be achieved by slightly changing the major sources…hm.
Observations of Isotopic Depletion From Ferretti et al, 2007 Heavy CH4 in late Holocene (why?) Pre-industrial depletion of 13CH4 (rise of agriculture) Enrichment in 13CH4 (anthropogenic)
Obs of atmospheric fractionation suggest a total emission fractionation of ~ -53‰ Preindustrial fractionaion is about -54‰: difficult to attain with mostly bacterial sources A Caveat: Net sink fractionation is very uncertain (Mikaloff-Fletcher et al, 2004): Cl vs. OH Bacteria preferentially produce 12C: bacterial CH4 is depleted (13C~-60‰) Biomass burning has little isotopic preference: BMB CH4 depends on plant material (~-20‰) Fossil CH4 is intermediate ~-40‰ 12C reacts faster with OH: the OH sink reduces13C Some Notes on Isotope Fractionation
Optimizing 4 Category Scenarios to Isotopes Optimal Estimation of source/sink process contributions using observations of isotopic depletion at 4 different times. Observations of atmospheric isotope depletion at 4 times Contributions (Tg CH4 /year) for each source & sink process Optimal gain matrix Observations of 13C depletion
Fitting four Scenarios to 13CH4 Observations Prior Scenarios Fit Scores Fit to Isotope Observations
Isotopically-consistent Inversion Scenarios? Isotope-Optimized Scenarios:
Forward Runs: Fit to Observations Protocol Run (2 = 13.2) HYMN Emissions (2 = 14.8) More comparison needed….
4D-Var IM Import LPJ wetlands (for 2004) into KNMI system Continued forward run evaluation Inversion of station obs with new prior emissions Inversion of new SCIAMACHY Isotope Inverse Modeling More sensitivity experiments Report 5-7 likely scenarios or “storylines” Submit paper beg. of 2009 Outlook for IM at KNMI / WP6
Details for HYMN Focus on natural emissions, especially wetlands. pre-calculated monthly -k[OH] fields = 9.02 OH: From TM5 forward modeling Wetlands, Wild Animals, Ocean Total, Termites Wetlands (2 sets),Geological seepage*, Open Ocean, Termites Natural Emissions Anthrop. Emissions Coal, Oil, Waste, Dom. Ruminants, Rice, BMB Fossil Fuel, Biogenic Anth., Rice, BMB Wetland distribution LPJ potential wetlands Kaplan *A new idea, motivated by isotope considerations
Details: 4D-Var Inversion at KNMI Control Vector (x) Dimension = 10 Categories x 2700 grid cells x 12 months + Initial Concentration = 326,000 * Can simplify the number of categories. Observations (y) NOAA surface network SCIAMACHY (new) obs vector dimension ~105 • Covariance Matrix (B) • 0 correlation between processes • gaussian spatial correlations with decorrelation length L ~ 500 km • exponential temporal correlation between months (for some processes Forward Model (H) TM5 6o x 4o resolution