Download
1 / 14
140 likes | 257 Views
Economies of Vertical Integration in the Swiss Electricity Sector. 74 companies observed from 1997-2005 36 companies are vertically integrated hydropower generators & electricity distributors (includes a small high voltage transmission network) 9 companies are only electricity distributors

E N D
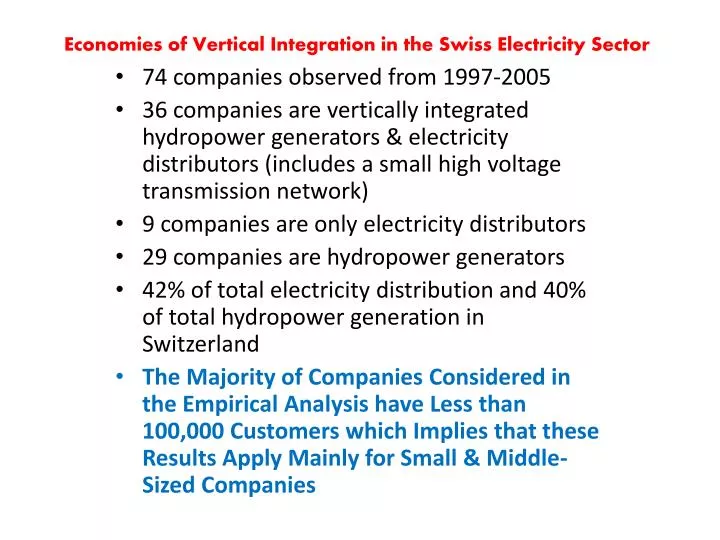
Economies of Vertical Integration in the Swiss Electricity Sector 74 companies observed from 1997-2005 36 companies are vertically integrated hydropower generators & electricity distributors (includes a small high voltage transmission network) 9 companies are only electricity distributors 29 companies are hydropower generators 42% of total electricity distribution and 40% of total hydropower generation in Switzerland The Majority of Companies Considered in the Empirical Analysis have Less than 100,000 Customers which Implies that these Results Apply Mainly for Small & Middle-Sized Companies
C= Total Expenditures of the Electricity Generation & Distribution Firms in a Given Year, Excluding Expenditure for Purchased ElectricityQ1= Electricity GenerationQ2= Electricity DistributionPL = The Ratio of Annual Labor Costs to the Total Number of Employees as Full Time EquivalentPC = (C-PL) Divided by the Capital Stock (Installed Capacity of Generation Assets & the Maximum Load of the Network)CD = The Number of Customers Divided by the Network Length Measured in KilometersEC = The Share of the Distributed Electricity to End Consumers LF = (Load Factor) = The Ratio of Average & the Maximum Distribution per HourCU = (Capacity Utilization) = The Ratio of the Average Hourly Generation per Year & the Installed Generation Capacity T = Linear Time Trend that Controls for Technical Change
Economies of Scale**As Output Increases the AC of Production Decreases Where C(Q1, Q2) is the total cost of producing Q1 and Q2, ∂C/∂Q1 is the marginal cost of producing product Q1, ∂C/∂Q2 is the marginal cost of producing product Q2. Global economies of scale describe the cost behavior caused by proportional changes in the entire production. ES > 1 Economies of Scale ES <1 Diseconomies of Scale ES = 1 NO Economies of Scale
Does solely Generation or Distribution exhibit product specific economies of scale within a vertically integrated utility? Product Specific Economies of Scale*Based on Changes of One Output or an Output Pair, While other Outputs are held Constant *The numerator represents the incremental cost resulting from producing output m and is the costs of producing all the outputs jointly except output m
Economies of Vertical Integration*Present When Costs can be Reduced by Joint Production of Multiple Outputs Across Different Production Stages *Ratio of Excess Costs of Separate Production to the Costs of Joint Production in One Company • C(Q1, 0) = The total cost when output for product Q2 is zero • C(0, Q2) is the total cost when output for product Q1 is zero. • EVI > 0 = Economies of Vertical Integration • EVI < 0 = Diseconomies of Vertical Integration
ECONOMIC THOUGHT • Economies of vertical integration between electricity production and distribution result from reduced transaction costs; better coordination of highly specific and interdependent investments in generation, transmission and distribution; less financial risk due to higher certainty in the sale activities; and avoiding the hold-up problem from technological interdependencies in different production stages • The organization of the electricity industry in several production stages (generation, transmission and distribution) implies that generators need transmission and distribution to get electricity to consumers and that transmission and distribution assets need generators. In this situation, the generator, transmission and distribution assets, created and independently owned, cannot be dedicated to other uses. Therefore, either side can ‘hold up’ the other
Cost FunctionSecond-Order Taylor Approximation • Panel data contains observations on multiple phenomena observed over multiple time periods for the same firms or individuals Fixed Effects Model = A unobserved effects panel data model where the unobserved effects is allowed to be arbitrarily correlated with the explanatory variables in each time period (Removes the unobserved effect prior to estimation because it is believed to be correlated with the RHS variables) Random Effects Model = The unobserved effects panel data model where the unobserved effects is assumed to be uncorrelated with the explanatory variables in each time period(Suppose one assumes that the unobserved effect is uncorrelated with the explanatory variables…Eliminating it would result in inefficient estimators) • Unobserved effect = An unobserved variable in the error term that does not change over time
Models • A Quadratic Multi-Stage Cost Function has been Estimated Using Two Econometric Specifications for Panel Data • A Random Panel Data (Generalized Least Squares) Model & a Random Coefficient (RC) Model • These Models have been Chosen to Consider the Effect of Unobserved Heterogeneity Across Different Electricity Distributors & Generators on the Values of the Economies of Scale & Economies of Vertical Integration • In econometrics, statistical inferences may be erroneous if, in addition to the observed variables under study, there exist other relevant variables that are unobserved, but correlated with the observed variables
Models • The GLS Specification Provides a Better Control for Omitted Variables • The RC Model provides an Additional Improvement Regarding the Potential Heterogeneity Bias in the Coefficients’ Estimates
Economies of Vertical Integration & Scale Economies • Both GLS (FE) & RC Estimates Suggest the Existence of Economies of Vertical Integration & Scale Economies Across a Major Part of the Sample
***, ** and * indicate 1%, 5% and 10% significance level respectively. The coefficient reported for each random parameter is the mean; (a) we report estimates of SD of normal distribution of random parameters
Reason Capacity…Do the Results Make Sense? 1. The Coefficients Reported for Both Models have the Expected Sign & are Significant & Similar in Magnitude 2. The Ouput & Input Price Coefficients are Highly Significant & have the Expected Positive Sign 3. The Effect of Customer Density is Negative, Showing that an Increase in the Customer Density Decreases Costs 4. The Coefficient of the Share of Sales to End Consumers is, as Expected, Positive in All Models 5. The Load Factor of the Network & the Capacity Utilization Factor are Negative, Suggesting that a Higher Peak Load Profile Leads to Higher Costs 6. Finally, in the GLS model the Coefficient of the Liner Time Trend Suggests a Cost Decrease in the Electricity Sector over the Observed Period, whereas in the RC model this Coefficient is not Statistically Significant
Distribution of Economies of Integration & Economies of Scale for Individual CompaniesEVI > 0 = Economies of Vertical IntegrationEVI < 0 = Diseconomies of Vertical IntegrationES > 1 Economies of Scale, ES <1 Diseconomies of Scale, & ES = 1 NO Economies of Scale(Same applies for product specific) Distribution of the Product-Specific Economies of Scale Estimated for Individual Companies
Conclusions 1.) The empirical results confirm the existence of significant economies of vertical integration & economies of scale for a majority of the electricity companies 2.) This suggests that additional costs could result from unbundling vertically integrated companies 3.) Thus, unbundling processes reduce the possibilities to exploit the advantages of vertical integration What does these results mean? Vertically integrated (Generation & Distribution) exhibit economies of vertical integration Perhaps larger utilities should be vertically unbundled?