Download
1 / 10
100 likes | 244 Views
GPI Measurements of L-H Transition. S.J. Zweben, R. Maqueda, T. Munsat, T. Biewer, C.E. Bush, R. Maingi, D. P. Stotler, and the NSTX Team NSTX Results Review 9/21/04. • Motivation • GPI diagnostic • Images, observations, and questions. Motivation.

E N D
GPI Measurements of L-H Transition S.J. Zweben, R. Maqueda, T. Munsat, T. Biewer, C.E. Bush, R. Maingi, D. P. Stotler, and the NSTX Team NSTX Results Review 9/21/04 • Motivation • GPI diagnostic • Images, observations, and questions
Motivation • See whether the L-H transition is really due to the poloidal shearing of edge turbulence, as in most theories (either DC or fluctuating zonal flows) from TTF ‘99
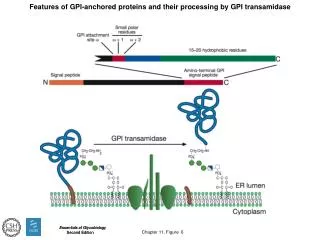
GPI Diagnostic in NSTX • Looks at Da or HeI light from gas puff I none f(ne,Te) • View ≈ along B field line to see 2-D structure B • Image coupled to camera with 800 x 1000 fiber bundle Gas manifold B field View GPI gas cloud (Biewer)
GPI Image Orientation viewing area ≈ 25x25 cm spatial resolution ≈ 1-2 cm separatrix RF limiter Typical image Using Princeton Scientific Instruments PSI-5 camera 250,000 frames/sec @ 64 x 64 pixels/frame 300 frames/shot, 14 bit digitizer, intensified
GPI Data in ‘04 • About 500 shots (almost all with Da) with: • Ohmic, L-mode, H-mode • L-H and H-L transitions • ELMs and high-n modes • LSN vs. USN vs. limited • MHD and RF effects • High beta and RWM coil • He puff and CIII light • Shot list and sample movies at: http://www.pppl.gov/~szweben/NSTX04/NSTX_04.html
Observations on L-H Transitions • L-H transitions look like a continuous evolution from turbulent blobs to a quiescent state in ≤ 0.1 ms, apparently without new spatial features or flows • Transient periods of H-like quiescence occur well before the main L-H transition • H-L transitions generally appear as high-n poloidal modes which evolve into radially moving blobs
Questions for Image Analysis • Is there an increase in poloidal flows (shear or zonal) just before the L-H transition (as in theory) ? • How much does the turbulence “dither” from L- to H-type as a function of time before the main L-H transition ? • Is there a consistent instability pattern leading from H-L ? • How do the transitions seen in GPI compare with those in the reflectometer, Firetip and probe diagnostics ?