Download
1 / 26
260 likes | 391 Views
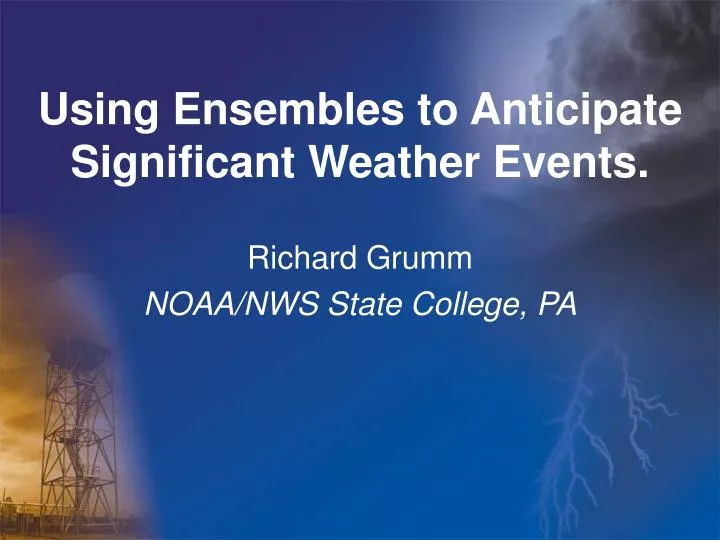
Using Ensembles to Anticipate Significant Weather Events. Richard Grumm NOAA/NWS State College, PA. Overview. Value of Ensemble Prediction Systems (EPS) unique events For patterns and probabilities Probabilities Key fields such as QPF, Precipitation type Probs and QPF can be used for GFE

E N D
Using Ensembles to Anticipate Significant Weather Events. Richard Grumm NOAA/NWS State College, PA
Overview • Value of Ensemble Prediction Systems (EPS) • unique events • For patterns and probabilities • Probabilities • Key fields such as QPF, Precipitation type • Probs and QPF can be used for GFE • Patterns as viewed by anomalies
Value and use of climatology • EC use the extreme forecast index (EFI) • EPS based climatology to find outliers related to significant weather events. • NCEP: • Probabilities of exceeding climatological values based on Global data • Bias-corrected ensemble mean, 10th, 50th , and 90th percentiles placed in climatological distribution • RMOP uses climatology • Others: using climatology directly with model data to find areas of big anomalies in EPS or model verse forecast. In standard deviations from normal.
Korean Peninsula Heavy rainfall • We will examine a major Flood event • Significant impact on North Korea • Devastated crops in mid-August 2007 • Ideal to see what happened • Examine aspects of a major flood where did it rain • Analysis and forecast issues can be addressed • What did the pattern look like and was it forecast as such? • Ideal application of ensembles • Precipitation amounts (Probabilities) and timing • Meteorological setting • Intensity of key features associated with heavy rainfall. • Key features associated with heavy rains events • Put features in a context Climate anomalies of key forecast variables
GEFS Plume for Central N. Koreavisualize the PDF and the time of heavy rainfall 0000 UTC 7 August 0000 UTC 8 August
Korean Peninsula Heavy rainfall • GEFS showed a strong signal • Very heavy rainfall in the correct general region • Anomalies showed and reinforced known pattern for heavy rainfall and implied convergence of solutions • Plumes showed the localized PDF and time of most likely accumulations • High probabilities of significant rainfall amounts.
Ohio Valley Floods • Heavy rainfall March 2008 • Lead to massive flooding Illinois to Ohio and most of the Ohio Valley • Well forecast by the NCEP GEFS and SREF
Rainfall with the event0.25x0.25 and 4km Stage-IV rainfall data
Ohio Valley Floods • Heavy rainfall March 2008 • Was well forecast by the NCEP GEFS • Good lead time • Good forecasts of the • Patterns and probabilities • QPF and PoPs could have been of value in GFE
Midwest Ice Storm 8-10 Dec 2007http://nws.met.psu.edu/severe/2007/10Dec2007.pdf • Big ice storm in the Midwest • Good SREF Precipitation type example • Followed a known pattern associated with ice storms in history • Much of these data could be used and displayed in GFE and D2D • Case study to be presented for Pleasant Hill WFO 28 October
Review • Value of Ensemble Prediction Systems (EPS) • For patterns and probabilities • Probabilities Key fields such as QPF • Patterns as viewed by anomalies • Some of these data can be used in AWIPS • PTYPE and QPF for GFE use and starting points • For forecaster decision aides • Ensembles are in stage like NWP was in the 1960-70s • They will improve and grow in importance and value over the next 10-15 years. • We need to get more forecasters invested using the EPS.