Download
1 / 8
110 likes | 318 Views
Monitoring the power performance of an offshore WEC using nacelle-based wind measurements and the Langevin power curve. Matthias Wächter, Patrick Milan, Philip Rinn , Joachim Peinke ForWind Center for Wind Energy Research Institute of Physics, Carl von Ossietky University of Oldenburg

E N D
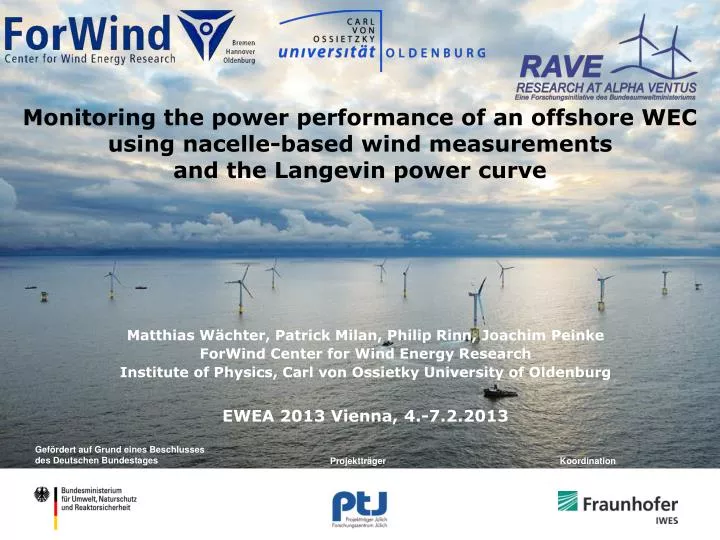
Monitoring the power performance of an offshore WECusing nacelle-based wind measurements and the Langevin power curve Matthias Wächter, Patrick Milan, Philip Rinn, Joachim Peinke ForWind Center for Wind Energy Research Institute of Physics, Carl von Ossietky University of Oldenburg EWEA 2013 Vienna, 4.-7.2.2013
Challenge of wind power conversion Conversion Complex, nonlinearinteraction Input Turbulent wind: Intermittent, extreme events Output »Turbulent« power
Wind energy conversion dynamics • Highly dynamical process on short time scales • Driven by turbulent wind • How to obtain the response dynamics of WEC? • Possible from wind and power data ~1Hz
Langevin power curve • Drift function reflects averageslope of power signal • Drift field shows deterministicdynamics of energy conversion • StablefixedpointsconstituteLangevin Power Curve Important properties • Shows short-time dynamics (~1s) • Quick detection of changes • Multiple fixed points possible • State-based vs. global averaging (as of IEC 61400-12) AV 4: REpower 5M
Langevin power curve monitoring • Daily LPC over 10 days, February 2011 • Wind: nacelle anemometer • Artifact caused by wind measurement • »Unfortunately«noturbineanomalieshere AV 4: REpower 5M Changes in dynamicalbehavioraredetected
Nacelle lidar-based Langevin power curve • Lidar scanner developed by SWE, U Stuttgart • Deployed at AREVA Wind M5000prototype, BHV • 1 day measurement AREVA Wind M5000 prototype Large potential of nacelle lidar-based power curve measurements
Nacelle lidar development at ForWind • Prototype developed within “LIDAR II” at Marine Physics group, U Oldenburg • Spinner integration • Robust • Cost-efficient • Field testing early 2013
Conclusions • Langevin power curve suitable for monitoring of power performance • Quick and clear detection of anomalies • Large potential for nacelle-based lidar wind measurements • Spinner-mounted lidar developed at ForWind Oldenburg Thankyouforyourattention! Thanksto: SWE U Stuttgart, REpower Systems SE, Areva Wind GmbH, andthe RAVE initiative