Download
1 / 29
290 likes | 299 Views
Overview of Maternal and Child Health Epidemiology. GCC/RH Morelos, January 28, 2013. Objectives. COUNT 2X2 tables DIVIDE: Ratios, proportions, rates Maternal Mortality Ratio (MMR) Infant Mortality Rate (IMR) Birth weight specific mortality rate (BWSMR) Proportionate Mortality

E N D
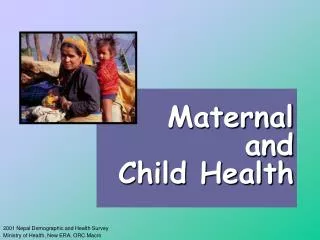
Overview of Maternal and Child Health Epidemiology GCC/RH Morelos, January 28, 2013
Objectives • COUNT • 2X2 tables • DIVIDE: Ratios, proportions, rates • Maternal Mortality Ratio (MMR) • Infant Mortality Rate (IMR) • Birth weight specific mortality rate (BWSMR) • Proportionate Mortality • Birth weight proportionate mortality rate (BWPMR) • Intervention package proportionate mortality rate (IPPMR) • COMPARE: Opportunity Gap
Cycle of Epidemiology Divide Count Compare
Counts Definition: The absolute number of cases or events related to a health outcome (maternal deaths, neonatal deaths, total number of patients seen, etc.)
Numerator/ Denominator Numerator Denominator • Both are counts • Choice of denominator primarily determines the meaning of the calculation
2 X 2 Table Outcome
2 X 2 Table Outcome=deaths
Cycle of Epidemiology Divide Count Compare
Ratios– Proportion and Rates Basic Formula: x/y x 10n Ratio: X and Y can be independent of each other or x may be included in y (male to female ratio, maternal mortality ratio=maternal deaths/live births) Proportion: a type of ratio, x is always included in y (low birth weight proportion) Rate: (often) a type of proportion; the occurrence of an event in a population over time (neonatal mortality rate, infant mortality rate, birth weight specific mortality rate, etc.)
Incidence vs. Prevalence • Both rates • Incidence – number of new cases of a disease in a defined population, during a particular time; rate of “infection” • Prevalence – the total number of cases of a disease in a population at a given time.; total burden of disease
Maternal Mortality Ratio x/y x 10n X = # deaths of women caused by pregnancy related causes Y = # live births during the same time interval N = 5 (10n= 100,000)
Infant Mortality Rate Definition: The proportion of deaths among live born infants during a given time period X = number of infant deaths Y = total number of infants N = 3 (10n = 1,000)
Birth Weight Specific Mortality Rate (BWSMR) Definition: The proportion of infants who died and weighed a given birth weight among all infants of that birth weight X = number of infants who died and weighed a given birth weight Y = total number of infants who weighed a given birth weight N = varies
Proportionate Mortality Rate x/y x 10n X = deaths linked to a particular cause or risk factor Y = deaths related to all causes or risk factors N = varies
Birth Weight Proportionate Mortality Rate (BWPMR) Definition: The proportion of infants of a given birth weight who died among all infants who died X = number of deaths among infants of a given birth weight Y = total number of births N = varies
Intervention Package Proportionate Mortality Rate (IPPMR) Definition: Proportion of deaths among infants whose birth weight(s) and period(s) of death are associated with a given intervention package X = number of deaths in an intervention package cell grouping Y = total number of births N = varies
The Opportunity Gap Definition: The potential for reduction in excessive mortality based on a comparison between rates already achieved by one population with those experienced by different population
How to Calculate the Opportunity Gap • Plot raw data for targeted subpopulation into the BABIES matrix
How to Calculate the Opportunity Gap 2. Calculate intervention package proportionate mortality rates
9 2 How to Calculate the Opportunity Gap 3. Select a standard for comparison 4. Subtract the rate for the targeted subpopulation from standard population - 2 7 = 1,9 4,8 1 1 0,8 1,2 1 3 1 5 3,5 4 6 Moldova Georgia, USA The opportunity gap
Opportunity Gap 7 Pre pregnancy interventions 3 Care During pregnancy interventions 5 Early neonatal care interventions 1 Intrapartum care interventions The opportunity gap