Download
1 / 23
230 likes | 236 Views
This research paper explores the Allee effect and demographic stochasticity in population dynamics, analyzing the birth and death probabilities and their impact on population size. It also examines the relationship between mean lambda and population size. The study investigates different species, including sea turtles and snow geese, and discusses survivorship graphs and birth schedules. Additionally, it explores the calculation of R0 (net reproductive rate) and its significance in population growth. The paper concludes by examining growth rates, population stability, and the mean generation time.

E N D
Allee Effect & Demographic Stochasticity? At each time step, 50% chance of birth, 50% chance of death 100 1 0 1 Time
Allee Effect & Demographic Stochasticity At each time step, 50% chance of male, 50% chance of female Each breeding pair produces two offspring, then die. • What is mean lambda for an infinitely large population? • 1 because MM mates with FF. • What is mean lambda for population size = 2? • 0.5 because MM and FF do not mate. M,M M,F F,M F,F M,F
Sea Turtle Management Eggs, Hatchlings Juveniles Sub-Adults Novice Breeders Mature Breeders
Sea Turtle Management Eggs, Hatchlings Juveniles Sub-Adults Novice Breeders Mature Breeders
Snow Goose Management Eggs, Hatchlings Juveniles Breeders (Age > 2)
Deaths lx = fx / f0 dx = lx - lx+1 qx = dx / lx
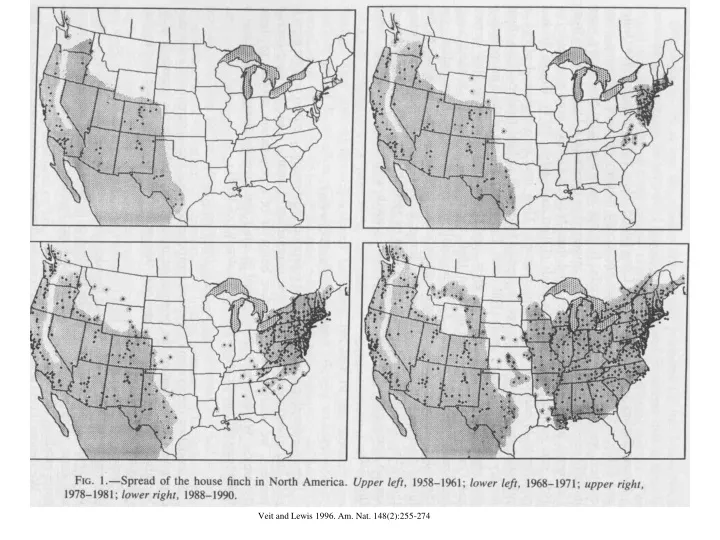
Survivorship Graphs http://www.sciencemag.org/cgi/content/full/291/5508/1491
Births • Mean number of female (or reproductive) offspring produced per female (or reproductive) individual. • Represents mean offspring produced for females that have survived to year “x”.
Births • What would the birth schedule look like for Pacific salmon?
Births • What would a possible birth schedule look like for Pacific salmon?
R0 • “Net reproductive rate” • Mean number of female offspring produced per female over her lifetime • Mean number of reproductive offspring produced per reproductive individual over its lifetime
Can We Calculate R0 From bx • Mean number of female offspring produced per female golden lion tamarin.
Can We Calculate R0 From bx • Mean number of female offspring produced per female golden lion tamarin. • NO! Represents mean offspring produced for females that have survived to year “x”.
Calculate R0 for a population of tamarins in which 50% of the females survive to the breeding season each year, starting one year after birth, and then produces 6 offspring (3 females) per year. This continues until the end of their 3rd breeding season, at which time all survivors die of old age.
Calculate R0 for a population of tamarins in which 50% of the females survive to the breeding season each year, starting one year after birth, and then produces 6 offspring (3 females). This continues until the end of their 3rd breeding season, at which time all survivors die of old age.
Calculate R0 for a population of tamarins in which 50% of the females survive to the breeding season each year, starting one year after birth, and then produces 6 offspring (3 females). This continues until the end of their 3rd breeding season, at which time all survivors die of old age.
Calculate R0 for a population of tamarins in which 50% of the females survive to the breeding season each year, starting one year after birth, and then produces 6 offspring (3 females). This continues until the end of their 3rd breeding season, at which time all survivors die of old age.
Calculate R0 for a population of tamarins in which 50% of the females survive to the breeding season each year, starting one year after birth, and then produces 6 offspring (3 females). This continues until the end of their 3rd breeding season, at which time all survivors die of old age.
Growth Rates • Population increases if r > 0, lambda >1, R0 > ? • Population is constant if r = 0, lambda =1, R0 = ? • Population declines if r < 0, lambda < 1, or R0 < ?
R0 vs. λ • R0 defines population growth per generation. • λ defines population growth for a given time step. • R0 = λ where 1 time step = 1 generation.
Mean Generation Time (G) and r • Mean age of all reproducing females • Mean age of mothers of all newborn females • Mean time between birth of a mother and all her offspring