Download
1 / 13
130 likes | 282 Views
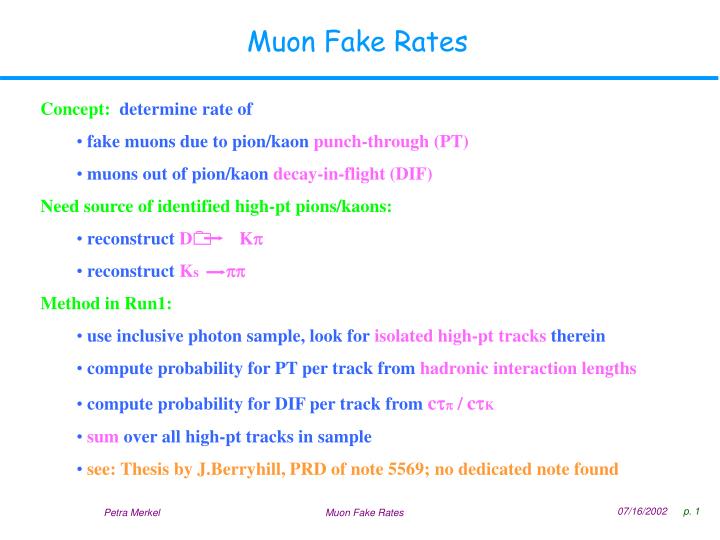
Muon Fake Rates. Concept: determine rate of fake muons due to pion/kaon punch-through (PT) muons out of pion/kaon decay-in-flight (DIF) Need source of identified high-pt pions/kaons: reconstruct D 0 K p reconstruct K s pp Method in Run1:

E N D
Muon Fake Rates • Concept: determine rate of • fake muons due to pion/kaon punch-through (PT) • muons out of pion/kaon decay-in-flight (DIF) • Need source of identified high-pt pions/kaons: • reconstruct D0 Kp • reconstruct Kspp • Method in Run1: • use inclusive photon sample, look for isolated high-pt tracks therein • compute probability for PT per track from hadronic interaction lengths • compute probability for DIF per track from ctp / ctK • sum over all high-pt tracks in sample • see: Thesis by J.Berryhill, PRD of note 5569; no dedicated note found
Ks Selection • Use B_CHARM dataset: • L1: (2 XFT tracks, opp. charge, Df < 1350 , SPt > 5.5) or (7 tracks w/ Pt > 2) • L2: 2 SVT tracks, c2 < 25, Pt > 2, 100 mm < |d0| < 1 mm • L3: 2 SVX-COT hybrid tracks, Pt > 2, |h| < 1.2, 120 mm < |d0| < 1 mm, • opp. charge, |DZ0| < 5 cm, 20 < |Df| < 900, Lxy > 200 mm, SPt > 5.5 • Offline selection: • Track cuts: Nax > 24, Nst > 24, |Z0| < 60 cm, |h| < 1.2, Pt > 2 • Track pairs: opp. charge, |DZ| < 5 cm, 20 < |Df| < 900, 1 leg Pt > 5 • Secondary vertex fit: CTVMFT algorithm, x2 < 8, Lxy > 1 cm, • d0(Ks) < 0.3 mm (SVX) / d0(Ks) < 0.3 cm (COT)
Ks Peak – BCHARM sample Peak: 0.46 < Mpp < 0.53 SB: 0.425 < Mpp < 0.46 0.53 < Mpp < 0.565 Mpp [GeV]
Pions – Kinematics D0 (COT) D0 (SVX) peak sideband eta D0 (SVX) : both legs have silicon hits D0 (COT) : only one leg or none have silicon hits Pt [GeV]
Muon Cuts • Use same cuts as in s(W mn) analysis: • Tracking: Nax > 24, Nst > 24 • Calorimeter, isolation: E(R<0.4)corrected for track < 2 • Calorimeter, MIP: Eem < max(2, 2+0.0115 (Pt – 100)) • Ehad < max(6, 6+0.028 (Pt – 100)) • Matching: |Dx|CMU < 3 cm, |Dx|CMP < 6 cm, (no cut for CMX)
Fake Rate – BCHARM sample • Ks in peak: 16,316 • (Pt>5): 17,724 [%] • is m: 117 = 0.66 +- 0.06 Muon fake rate from • is CMU m: 90 = 0.51 +- 0.05 PT and DIF [%]: • is CMP m: 31 = 0.17 +- 0.03 • is CMUP m: 20 = 0.11 +- 0.03 peak – SB: • is CMX m: 17 = 0.10 +- 0.02 all m: 0.65 +- 0.06 CMU m: 0.52 +- 0.06 Events in SB: 1,032 CMP m:0.16 +- 0.03 p (Pt>5): 1,179 [%] CMUP m: 0.11 +- 0.03 p is m: 9 = 0.76 +- 0.25 CMX m: 0.09 +- 0.02 p is CMU m: 4 = 0.34 +- 0.17 p is CMP m: 5 = 0.42 +- 0.19 p is CMUP m: 2 = 0.17 +- 0.12 p is CMX m: 2 = 0.17 +- 0.12
Fake Rate peak sideband ALL ELENOV ELE8x20 BCHARM PHOTON DIPHOTON
Fake Rate – diff. distr. CMUP CMU Only Ks peak fake rates shown, not SB subtracted yet… CMP Pt [GeV] eta
ELECTRON sample SVX COT d0 [cm] Mpp [GeV]
Physics Bias? • Observe systematic difference between different datasets: • BCHARM, DIPHOTON: high fake rates • PHOTON, ELECTRON: low fake rates • BCHARM, DIPHOTON are muon enriched • Hypothesis: in muon enriched samples the pion track gets accidentally matched to the stub from a real muon nearby • Check:loosen / tighten |Dx| cut on CMU, CMP : fake rate / • (check it both for the BCHARM and the electron sample)
Physics Bias! Tendency also seen in electron dataset…but within statistical error… |Dx|<15 cm |Dx| < 3 / 6 cm |Dx| < 1 cm ELECTRONS BCHARM Difference between datasets is good handle on systematic uncertainty of this measurement
Comparison to Run1 Numbers In Run1 (photon-lepton analysis, J.Berryhill): 1.87 +- 0.99 PT background events 1.08 +- 1.20 DIF background events 2.95 +- 2.19 background events DIF+PT 398 high-Pt tracks in inclusive photon sample Using (0.65 +- 0.06)% fake rate for Run2 Combine with 398 tracks: 2.6 +- 0.2 background events Main systematic uncertainty in Run1 was pion/kaon fraction, probably much too pessimistic…
ToDo • Still to do for Ks: go to lower Pt (2 instead of 5 GeV) to see Pt dependence better • plot peak-SB fake rate vs. eta and Pt • Do the same for D0 in order to get to higher Pt and to get kaons: • the signal is there, needs clean-up: