Download
1 / 17
170 likes | 328 Views
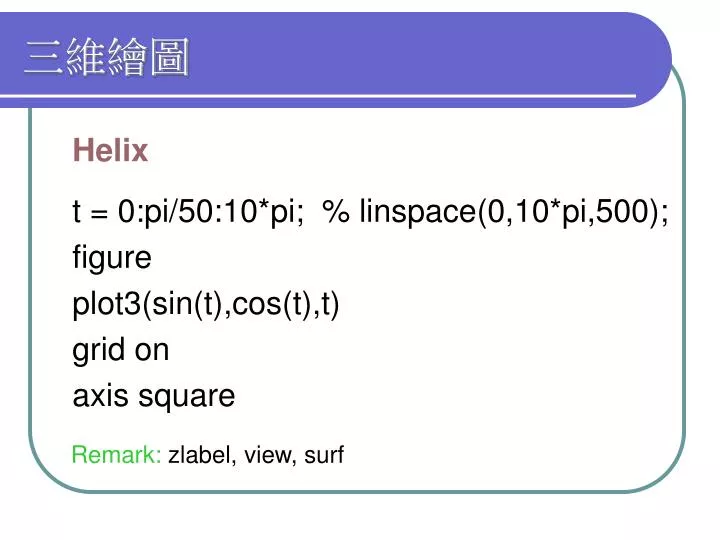
三維繪圖. Remark: zlabel, view, surf. Helix t = 0:pi/50:10*pi; % linspace(0,10*pi,500); figure plot3(sin(t),cos(t),t) grid on axis square. 三維繪圖 mesh, surf. m esh : 可畫出立體的「網狀圖」( Mesh Plots ) surf: 可畫出立體的「曲面圖」( Surface Plots ). z = [0 2 1; 3 2 4; 4 4 4; 7 6 8];

E N D
三維繪圖 Remark: zlabel, view, surf Helix t = 0:pi/50:10*pi; % linspace(0,10*pi,500); figure plot3(sin(t),cos(t),t) grid on axis square
三維繪圖 mesh, surf • mesh:可畫出立體的「網狀圖」(Mesh Plots) • surf: 可畫出立體的「曲面圖」(Surface Plots) z = [0 2 1; 3 2 4; 4 4 4; 7 6 8]; subplot(1,2,1); mesh(z); title('mesh'); xlabel('x-axis= column index'); % X 軸的說明文字 ylabel('y-axis= row index'); % Y 軸的說明文字 subplot(1,2,2); surf(z); title('surf')
三維繪圖 • meshgrid 產生 x 及 y (均為向量) 為基準的格子點 (Grid Points),其輸出為 xx 及 yy(均為矩陣),分別代表格子點的 x 座標及 y 座標。 • linspace
三維繪圖 x = 3:6;y = 5:9; [xx, yy] = meshgrid(x, y);% xx 和 yy 都是矩陣 zz = xx.*yy; % 計算函數值 zz,也是矩陣 subplot(1,2,1); mesh(zz);axis tight; title('zz'); subplot(1,2,2); mesh(xx, yy, zz);axis tight; title('zz w.r.t xx and yy');
三維繪圖 x = linspace(-2,2,25);y = linspace(-2,2,25); [xx, yy] = meshgrid(x, y); zz = xx.*exp(-xx.*xx - yy.*yy); mesh(xx, yy, zz);axis tight; title('f(x,y) = x exp( -x^2 - y^2 )'); xlabel('x'); ylabel('y'); zlabel('f(x,y)')
三維繪圖 x = linspace(-2,2,25);y = linspace(-2,2,25); [xx, yy] = meshgrid(x, y); zz = xx.*exp(-xx.*xx - yy.*yy); surf(xx, yy, zz);axis tight; title('f(x,y) = x exp( -x^2 - y^2 )'); xlabel('x'); ylabel('y'); zlabel('f(x,y)')
三維繪圖 peaks • peaks: • 為了方便測試立體繪圖,MATLAB 提供了一個 peaks 函數,可產生一個凹凸有致的曲面,包含了三個局部極大點(Local Maxima)及三個局部極小點(Local Minima) • 其方程式為: • help peaks
延伸學習 • meshz, meshc • waterfall • griddata • shading interp • surfl • colormap
griddata 所有的資料點都必需是在格子點上,MatLab才能根據每點的高度來作圖。如果所給的資料點不在格子點上,我們必需先用 griddata 指令來進行內插法以產生格子點。
griddata x = 6*rand(100,1)-3; % x 為介於 [-3, 3] 的 100 點亂數 y = 6*rand(100,1)-3; % y 為介於 [-3, 3] 的 100 點亂數 z = peaks(x, y); % z 為 peaks 指令產生的 100 點輸出 [X, Y] = meshgrid(-3:0.1:3); Z = griddata(x, y, z, X, Y, 'cubic'); mesh(X, Y, Z); hold on; plot3(x, y, z, '.', 'markersize', 16); % 晝出 100 個取樣 hold off axis tight


![헬릭스 (HELIX) [ 페트병 , 캔 자동 선별 회수기 ]](https://cdn1.slideserve.com/3365784/slide1-dt.jpg)