Download
1 / 18
180 likes | 270 Views
Large-angle anomalies in the microwave background: Are they real? What do they mean?. Ted Bunn University of Richmond. TexPoint fonts used in EMF. Read the TexPoint manual before you delete this box.: A A A A A A A A. CMB anisotropy is incredibly consistent with the standard model….

E N D
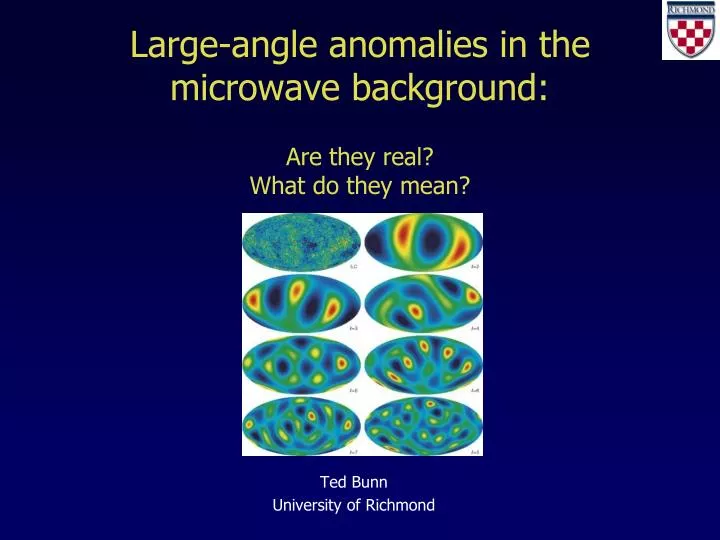
Large-angle anomalies in the microwave background:Are they real?What do they mean? Ted Bunn University of Richmond TexPoint fonts used in EMF. Read the TexPoint manual before you delete this box.: AAAAAAAA
CMB anisotropy is incredibly consistent with the standard model… but some claims have been made of unexpected features on large angular scales. Anomalies may not mean anything! (a posteriori statistics) Moriond
Puzzles I’ll focus on • Large-scale power deficit • North-south asymmetry • Alignment of multipoles (“axis of evil”) Moriond
Is there anything to explain? • How not to do statistics: • Notice something strange in your data. • Devise a statistic a posteriori to quantify how strange it is. • Take seriously the p-values derived from that statistic. • All claimed anomalies suffer from this problem to some extent Argument for ignoring the whole subject. But… • We use “invalid” statistical methods all the time, relying on intuition and further tests to keep us honest. • If these anomalies are real, they’re important! • My unjustified opinion: We should proceed, but with skepticism. Moriond
Example • A simulated CMB map, made in the “usual” way (Gaussian, statistically isotropic) and smoothed to show only large-scale features: • The two most extreme hot spots are almost perfectly antipodal and cause positive skewness. • Easy to devise statistics to show this is unlikely at > 99% confidence. Moriond
Should we care about the large-angle anomalies? My (unjustified) opinions: • The problem of a posteriori statistics is a reason to tread carefully, but not a reason to dismiss the whole subject outright. • We use “invalid” statistical methods all the time in science, and rely on our intuition to decide whether it’s OK. • The possibility that the CMB is telling us something nonstandard about the largest-scale features in the Universe is very exciting – worth looking into. Moriond
Anomaly 1: Lack of large-scale power • Low quadrupole C2 • Large cosmic variance + need to mask statistical significance is not strong. • Discrepancy looks much more striking when phrased in terms of the real-space correlation function, instead of the spherical harmonic coefficients. is low compared to standard model at 99.8% confidence (Copi et al. 2006). Moriond
How a posteriori is this? • Specific statistic S1/2 : Very. • Looking at the correlation function instead of the power spectrum: Not at all. • C(q) wasthestandard tool in the old days, especially on small scales. • My opinion: The fact that C(q) is essentially zero for large angles is intriguing. Smoot et al. 1992 Alsop et al. 1991 Moriond
What could it mean? • Possibilities: • Statistical fluke • Foreground • Systematic error • New physics (topology, …) • Theorem: No independent additive contaminant to the standard model can explain this anomaly: If a contaminant is invoked to explain any other problem, it worsens this one! P(with contaminant) < P(without contaminant) (Copi et al. 06, Bunn & Bourdon 08) Moriond
Anomaly 2: Hemisphere asymmetry • ~10% more fluctuation power in one hemisphere than in the other. • Initial tests: p ~ .01. Eriksen et al 2003 Ratio of hemisphere power spectra, l=2-63. Moriond
Why you should take this seriously • Tests done for multiple different ranges of l. • Directions of asymmetry are similar. • If standard model is right, these should be independent random directions. • All but the first one can be thought of as a priori. Hansen et al 2008 Moriond
Anomaly 3: Alignment of multipoles • Maps with l=2,3 pick out approximately the same plane on the sky. • l=3 map is more planar than expected. • Normal to plane lies near ecliptic, CMB dipole. • Depending on which of these “surprises” you include, formal statistical significance can be p ~ 0.001. • My unjustified opinion: This is the sort of pattern that humans are good at spotting, whether or not it’s there. Hinshaw et al. 2007 Moriond
Possible explanations? • Each anomaly could be due to a fluke, systematic error, foreground, or new physics. • Sample possibilities for new physics: • Spontaneous isotropy breaking (Gordon et al.): Radiation field couples to some other field, with only large-scale fluctuations. • Preferred direction picked out during inflation (Ackerman et al.). Moriond
Do the data justify a more complicated model? Hoftuft et al. 2009 • Bayesian evidence: One way of deciding whether to prefer a more complicated theory: • Evidence ratio=Factor by which posterior probability ratio changes as a result of the data. • Complicated theories automatically disfavored. • In all cases examined so far, BE provides only weak to moderate support for the nonstandard model. Zheng & Bunn, in prep. Zheng & EB, in prep. SIB1 SIB2 PD Evidence raito Cutoff in prior Moriond
So what should we do? • Hard to know how seriously to take any of this! • Solution to the problem of a posteriori statistics: Get a new data set, for which the tests are a priori. • Need a data set that probes other perturbation modes on ultralarge scales: • CMB polarization • Large-scale structure / 21 cm tomography? • Kamionkowski-Loeb remote quadrupole measurements? Moriond
Large-scale power deficit in CMB polarization • Define a statistic precisely analogous to S1/2 for polarization maps. • is (nearly) uncorrelated with . it can be regarded as an a priori statistic. • If is anomalously small, then something interesting is happening. All pol Wisconsin
Remote quadrupole measurements • CMB photons scatter in a galaxy cluster. • Induced polarization tells us the CMB quadrupole at the cluster’s location & look-back time. • Strength of signal < 1 mK. Hard but not impossible. • Lets us measure new modes of the radiation field on the scales corresponding tol ~ 5-10. Galaxy Cluster Us Cluster LSS Our LSS (Kamionkowski & Loeb 1997; Bunn 2006) Moriond
Conclusions • Large-angle CMB anomalies don’t “prove” that anything nonstandard is going on, but may provide hints of places to look for interesting phenomena on large scales. • Important to make predictions and choose statistics in advance for new data sets, to avoid a posteriori statistics. Moriond