Download
1 / 36
370 likes | 520 Views
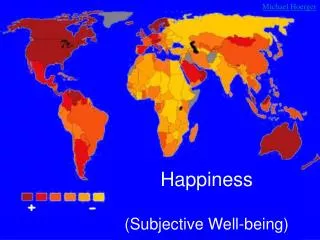
Love and money: non-linear moderators of subjective wellbeing relevant to public policy. Robert A. Cummins 1 Anna L.D. Lau 2 Jacqui Woerner 1 Adele Gibson 1 Adrian Tomyn 1 Jenny Walter 1 Lufanna Lai Ching 1 James Collard 1 1 Australian Centre on Quality of Life, Deakin University

E N D
Love and money: non-linear moderators of subjective wellbeing relevant to public policy Robert A. Cummins1 Anna L.D. Lau2 Jacqui Woerner1 Adele Gibson1 Adrian Tomyn1 Jenny Walter1 Lufanna Lai Ching1 James Collard1 1Australian Centre on Quality of Life, Deakin University http://www.deakin.edu.au/research/acqol 2Hong Kong Polytechnic University This manuscript contains notes below each slide. To view these notes, open in Powerpoint , go to ‘View’, and click on ‘Notes Page’
Translation High population SWB is desirable Therefore, public policy should be directed to increasing population SWB The best way to do this is through love and money But the means are complicated by the fact that the relationships are non-linear
Why is population happiness relevant to public policy? Positive emotions build a range of desirable characteristics as: Physical resources (health, longevity) Social resources (friendliness, social capital) Intellectual resources (intellectual curiosity, expert knowledge) Psychological resources (resilience, optimism, creativity)
Personal Wellbeing Index • Standard of living • Health • Achieving in life • Relationships • Safety • Community connectedness • Future security ( SWB ) How do we measure Subjective Wellbeing? “How satisfied are you with your -----?”
Our data are drawn from the Australian Unity Wellbeing Index Surveys Geographically representative sample N = 2,000 Telephone interview #1: April 2001 ------------ #18: October 2007
77 >S11 76 >S2, S4, S5 Scores above this line are 75 significantly higher than S1 Strength of satisfaction 74 73 72 Major events 1 2 3 4 5 6 8 7 preceding survey Survey S7 Jun 2003 S5 Nov 2002 S9 Nov 2003 S3 Mar 2002 S6 Mar 2003 S4 Aug 2002 S8 Aug 2003 S2 Sept 2001 S14 Oct 2005 S16 Oct 2006 S10 Feb 2004 S11 May 2004 S13 May 2005 S15 May 2006 S12 Aug 2004 S17 Apr 2007 S1 Apr 2001 Date Personal Wellbeing Index 2001 - 2007 Key: 1 = September 11 2 = Bali Bombing 3 = Pre-Iraq War 4 = Hussein Deposed 5 = Athens Olympic 6 = Asian Tsunami 7 = Second Bali Bombing 8 = New Industrial Relations Laws
77 >S11 76 >S2, S4, S5 Scores above this line are 75 significantly higher than S1 Strength of satisfaction 74 73 72 Major events 1 2 3 4 5 6 8 7 preceding survey Survey S7 Jun 2003 S5 Nov 2002 S9 Nov 2003 S3 Mar 2002 S6 Mar 2003 S4 Aug 2002 S8 Aug 2003 S2 Sept 2001 S14 Oct 2005 S16 Oct 2006 S10 Feb 2004 S11 May 2004 S13 May 2005 S15 May 2006 S12 Aug 2004 S17 Apr 2007 S1 Apr 2001 Date Personal Wellbeing Index 2001 - 2007 This represents a 3.0 percentage point variation Key: 1 = September 11 2 = Bali Bombing 3 = Pre-Iraq War 4 = Hussein Deposed 5 = Athens Olympic 6 = Asian Tsunami 7 = Second Bali Bombing 8 = New Industrial Relations Laws
Why is happiness held so steady? Homeostasis Just like we hold body temperature steady Subjective wellbeing homeostasis
X Subjective wellbeing Bad stuff Major external protective resources (Money, Relationships) Internal resources (eg. Finding meaning for the bad event) Homeostasis is maintained by using resources for defence Money is a flexible resource that allows people to defend homeostasis and their happiness
Homeostasis can fail Overwhelming Negative Challenges Subjective wellbeing The result of subjective wellbeing loss is depression
How can we use this knowledge to identify disadvantaged groups in Australia? Their mean SWB can be examined against the normative range for group mean scores
? ? SWB normative range for group mean scores in Australia 80 76.4 75 Normal range 73.4 ? 70 . PWI 65 60 55 Group A Group B Group C
Demographic investigation Combined data from 16 surveys N≈30,000 G x All others (2 x 36) 72 A x All others (7 x 31) 217 I x All others (7 x 31) 217 HC x All others (5 x 33) 165 RS x All others (6 x 32) 192 ES x All others (11 x 27) 297 G x A x I (2 x 7 x 7) 98 G x A x HC (2 x 7 x 5) 70 G x A x RS (2 x 7 x 6) 84 G x A x ES (2 x 7 x 11) 154 I x RS x ES (7 x 6 x 11) 462 G x I x ES (2 x 7 x 11) 154 HC x RS x I (5 x 6 x 7) 210 HC x ES x I (5 x 11 x 7) 385 RS x ES x I (6 x 11 x 7) 462 Categories (Number of Cells) Gender - G (2) Age - A (7) Income - I (7) Household Composition - HC (5) Relationship Status – RS (6) Employment Status – ES (11) Total number of cells = 3,277
Low Wellbeing in Australia . Major risk factors
What are the implications of thisunderstanding for public policy? To manage the two major resources that protect SWB • The management of national wealth 1.1 Managing inflation 1.2 Wealth distribution 1.3 Assisting disadvantaged groups 2. Policy on human relationships
Inflation Consumer Price Index (for the quarter prior to the survey) CPI Level of satisfaction r = -.48 , p<.025
How can we increase population SWB through wealth? Public Policy In the conventional view it is automatic IncreasingNational Wealth Increasedpopulationhappiness
Mean of percent Happy and percent Satisfied with life as a whole GNP/capita (World Bank purchasing power parity estimates, 1995 US
550 500 450 400 GDP is held as a percent of its 1958 value 350 300 250 200 150 100 50 0 1958 1960 1962 1964 1966 1970 1974 1976 1978 1980 1982 1987 Year Economic growth and Subjective Wellbeing in Japan Deflated GDP/capita Life satisfaction is the actual value for each year Life Satisfaction (Diener & Biswas-Diener, 2002)
It is not just about getting wealthier Public Policy IncreasingNational Wealth EquitableWealth Distribution Increasedpopulationhappiness As countries become richer, increases in population happiness can be achieved through managing the distribution of wealth
World Map of Gini coefficients http://en.wikipedia.org/wiki/Image:World_Map_Gini_coefficient.png Denmark = 23.2 Hong Kong = 54.3 Australia = 35.2 Gini index 0 = perfect economic equality 100 = perfect inequality
Norway Sweden Denmark Who is the happiest of them all? Scandinavian welfare model causing wealth distribution
40 35 33.1 30 25 Frequency 20 17.9 17.1 15.1 15 10 7.0 5.5 5 1.7 1.2 0.6 0.5 0.3 0 0 1 2 3 4 5 6 7 8 9 10 The principle is simple How satisfied are you with your life as a whole? N≈30,000 Pathological Normal The addition of resources here will cause the tail of the distribution to move to the right, and the mean population happiness will increase as a consequence
Special purpose samples Members of Carers Australia Mailed questionnaires July 2007 N ≈ 4,000 returns
80 70 65+ 49-64 60 50 Level of 32-48 depression 40 30 22-31 20 0-21 10 0 Diagnostic ranges of depression Carer sample average NormalMildModerateSevere Extremely depression depression depression severe depression
Depression is expensive Hawthorne, G., Cheok, F., Goldney, R., Fisher, L., 2003. The excess cost of depression in South Australia: a population-based study. Aust. N. Z. J. Psychiatry 37, 362–373. Australia Direct cost/annum ≈ US$ 2,500 Indirect cost ≈ US$ 8,500 TOTAL ≈ US$ 11,000
X Bad stuff Subjective wellbeing Protective resources (eg.money, relationships) Protecting homeostasis Intimate relationships help to protect wellbeing against negative challenges
It is almost universally assumed that any level of support is better than none eg. “How much support do you receive from your partner? [ 0 – 10] Researchers make two assumptions as: • A rating of 4 is better than a rating of 3. • The data can be analysed through linear statistics
Level of support from partner Never married 72.0 Live alone 70.6 80% (51%) (15%) (14%)
The protective/damaging effect of relationships with Age Married 84 Never married 82 Divorced 80 Normal range 79.5 78.2 77.5 78 77.5 77.2 76.9 76.8 76.2 76.8 76 75.4 74.2 74 SWB 72 70.3 70 69.9 69.6 69.4 68.3 68 68.1 66.6 67.9 66 66.0 64 18-25 26-35 36-45 46-55 56-65 66-75 76+ Age • Questions relevant to Public Policy: • How can we strengthen marriages? • Why are fewer young people getting married? • What are the implications of easy vs difficult divorce? • Should we assist single people to find a partner?
Conclusions • Measuring population wellbeing allows us to identify demographic subgroups with low wellbeing. • Targeting such groups for additional resources will act to raise the population wellbeing overall. • 3. As low wellbeing is an indicator of depression, and as depression is a very expensive condition, the above strategy also has advantages for the economy. • 4. There is both a social and an economic advantage from public policy directed to the enhancement of population wellbeing.
References Cummins, R. A. (2003). Normative life satisfaction: Measurement issues and a homeostatic model. Social Indicators Research, 64, 225-256. Cummins, R. A., & Lau, A. L. D. (2004) The motivation to maintain subjective well-being : A homeostatic model. In H. Switzky (Ed.), International Review of Research on Mental Retardation: Personality and Motivational Systems in Mental Retardation, 28, (pp. 255-301). Amsterdam: Elsevier. Cummins, R. A., & Nistico, H. (2002). Maintaining life satisfaction: The role of positive cognitive bias. Journal of Happiness Studies, 3, 37-69. Cummins, R. A., Eckersley, R. Pallant, J. Van Vugt, J, & Misajon, R. (2003). Developing a national index of subjective wellbeing: The Australian Unity Wellbeing Index. Social Indicators Research, 64, 159-190. Cummins, R. A., Gullone, E. & Lau, A. L. D. (2002). A model of subjective well being homeostasis: The role of personality. In: E. Gullone & R. A. Cummins (Eds.), The universality of subjective wellbeing indicators: Social Indicators Research Series (pp. 7-46). Dordrecht: Kluwer. Cummins, R. A., Eckersley, R., Okerstrom, E., Woerner, J. & Tomyn, A.(2005). Australian Unity Wellbeing Index: Report 13.0 – “The Wellbeing of Australians – Caregiving at Home”. Melbourne: Australian Centre on Quality of Life, School of Psychology, Deakin University. ISBN 1 74156 014 4 http://www.deakin.edu.au/research/acqol/index_wellbeing/index.htm Cummins, R. A., Hughes, J., Tomyn, A., Gibson, A., Woerner, J., & Lai, L. (2007). Australian Unity Wellbeing Index: Report 17.1 - The Wellbeing of Australians – Carer Health and Wellbeing”. Melbourne: Australian Centre on Quality of Life, School of Psychology, Deakin University. ISBN 978 1 74156 092 3 http://www.deakin.edu.au/research/acqol/index_wellbeing/index.htm
References continued Cummins, R. A., Walter, J. & Woerner, J. (2007). Australian Unity Wellbeing Index: Report 16.1 – “The Wellbeing of Australians – Groups with the highest and lowest wellbeing in Australia”. Melbourne: Australian Centre on Quality of Life, School of Psychology, Deakin University. ISBN 978 1 74156 079 4 http://www.deakin.edu.au/research/acqol/index_wellbeing/index.htm Cummins, R. A., Woerner, J. & Tomyn, A., Knapp, T. & Gibson, A. (2005). Australian Unity Wellbeing Index: Report 14.0 – “The Wellbeing of Australians – Personal Relationships”. Melbourne: Australian Centre on Quality of Life, School of Psychology, Deakin University. ISBN 1 7415 6024 1 http://www.deakin.edu.au/research/acqol/index_wellbeing/index.htm Diener, E., & Biswas-Diener, R. (2002). Will money increase subjective well-being? Social Indicators Research, 57(2), 119-170. Ferguson, K. M., & Mindel, C. H. (2007). Modeling fear of crime in Dallas neighborhoods: A test of social capital theory. Crime and Delinquency, 53(2), 322-349. Hawthorne, G., Cheok, F., Goldney, R., Fisher, L. (2003). The excess cost of depression in South Australia: a population-based study. Australian & New Zealand Journal of Psychiatry, 37, 362–373 International Wellbeing Group (2006). Personal Wellbeing Index, Australian Centre on Quality of Life, Deakin University, Melbourne: http://www.deakin.edu.au/research/acqol/instruments/wellbeing_index.htm Louw, A. (2007). Crime and Perceptions after a Decade of democracy. Social Indicators Research. 81. 235–255; Lovibond, S. H., & Lovibond, P. F. (1995) Manual for the depression anxiety stress scales, Psychology Foundation, Sydney. Lyubomirsky, S., King, L., & Diener, E. (2005) The benefits of frequent positive affect: Does happiness lead to success? Psychological Bulletin, 131(6), 803-855. Scandinavian Welfare Model. Wikipedia, http://en.wikipedia.org/wiki/Scandinavian_welfare_model