Download
1 / 24
240 likes | 423 Views
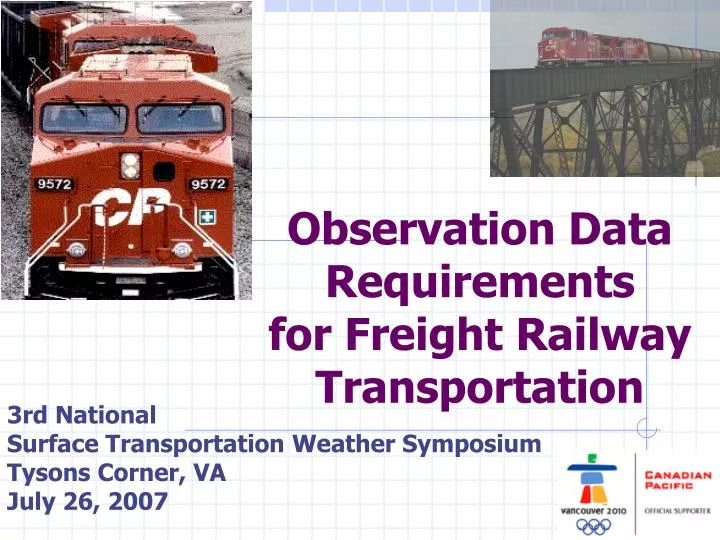
Observation Data Requirements for Freight Railway Transportation. 3rd National Surface Transportation Weather Symposium Tysons Corner, VA July 26, 2007. Outline. Type of climatic hazards that influence railways Cost and influence of natural hazards

E N D
Observation Data Requirementsfor Freight Railway Transportation 3rd National Surface Transportation Weather Symposium Tysons Corner, VA July 26, 2007
Outline • Type of climatic hazards that influence railways • Cost and influence of natural hazards • Example of a technical initiatives to reduce hazard • Needs for data and criteria 3rd NSTWS - Canadian Pacific
Ways weather affects railways • High temperatures- Sun (rail) buckles or kinks - Forest and grass fires burning ties • 2. Low temperatures- Icing of switches - Broken rail - Frost heaves • - Frost jacking of rock slope • 3. High antecedent precipitation conditions contribute • - Increased frequency of earth slides • - Debris flows • - Flooding • - Scour erosion to bridges and embankments • - Culverts failure • 4. High wind • - toppled empty double stake rail cars • Results • - 9 Fatalities and ~100 injuries in last 38 years on CP 3rd NSTWS - Canadian Pacific
Rail buckles (kinks) due to high temperature and radiant heating 3rd NSTWS - Canadian Pacific
2. Severe weather and the impact of natural hazards on railways Emerson Sub, Mile 63.8 April 30, 1997 MB, Canada - North ND, USA - South CPR tracks 3rd NSTWS - Canadian Pacific Photo from Manitoba Conservation
Cranbrook, Fording, and Bryron Creek Subs June 5, 1995 Sparwood and Fernie, SW BC Bryon Creek Sub, Mile 7.7 Michel Creek Bryon Creek Sub, Mile 11.11 Andygood Creek Fording Sub, Mile 17.50 3rd NSTWS - Canadian Pacific
Kamloops, BCTHOM 086.70 March 12, 2007103 hr service interruption 3rd NSTWS - Canadian Pacific
1. Cost of various types natural hazards • Natural hazards cost CP (the smallest NA Class 1) an about $12 million in 2007 • In 2007 (El Nino winter) 58% Planned & 42% Unplanned (emergency response) • Not including lost revenue 3rd NSTWS - Canadian Pacific
Railway Ground Hazard Research Program:……Ground Hazard Risk to CNR • Revenue costs are exponential after 48 hours • GH’s outages are double any other causes averaging 1.1 days 3rd NSTWS - Canadian Pacific
Technical initiatives • Weather information system • RailWIS • Wind – initiating track side anemometer program to deal with severe wind derailments • Development of earth slide and debris flow warning criteria 3rd NSTWS - Canadian Pacific
Map Coverage & Panning Area [For Zoom factors greater than 100%, a blue overlay shows the coverage and location of the main map. To relocate the main map, click and drag the blue overlay within the overview window.] Name of Active Station Database [Caution: The presence of “FILTERED” in the database name indicates that the displayed SWAL status (color of the map symbols) IS POTENTIALLY NOT the highest SWAL status for any given station. Please see the setting of the “Associate station color with…” option on the “Display Options Menu” ] SWAL Flashing Surround Resets [Click on “Current” or “Master” to stop the flashing (Indicates SWAL alarm) of the map surround for the active or, all databases. This action also deletes any colored database outline.] SWAL Status Display area [Symbol color indicates station SWAL status (see legend). Click on any symbol to select station and display data in “Station Data Display Area”.] Map Zoom Factor Control [Click and select zoom level.] Station Data Display Area [ Click and hold scroll controls to view data for the selected station. Each data item is color-coded according its SWAL status.] Map Panning Controls [Click to pan map in any of the four directions for zoom levels beyond 100%.] Map Surrounds flashes red when the SWAL levelreaches alarm status for any station. Report Generator Functions [Alternatively click on map station symbols and the “Add Station” text to create a text report that can be “View”ed, “Print”ed and “Clear”ed ] Active Weather Warning List Area & Access Link. [Click on any message to view details on given warning. Viewed warnings change color. Click and hold scroll controls to view long lists of messages. See “Display Options Menu” to also hide viewed warnings within list area. Note: Warnings are only updated when the Main Data Page is “Refreshed” (see Display Options Menu”.] Display Options Menu Access Link [Click on text to activate display options menu controlling: map layers, station filtering by SWAL status, station color assignment, display units, page refresh mode and, display of viewed warnings. Please refer to user guide for details.] Map Symbol Legend Access Link [Click on text to view legend of map symbols and color coding assignment] Station Database Selection Area [Click on any one radial button to activate and display data of given database. Color of text and outline indicates highest SWAL status for each database. The outlines will disappear as the flashing alarm display is reset. Note: RED color indicates at or above critical conditions, YELLOW indicates approaching critical conditions and Black, within operational limits.] RailWIS – Rail Weather information system 3rd NSTWS - Canadian Pacific
5. Weather hazard information system Data source Processing/presentation Notification Weather Services (NWS & EC) Weather information supplier Railway GIS display Calculate indices Real time weather station data Exceeds Network management centre & Track maintenance Compare to 10, 50 and 100 year return period indices Weather radar data SWAL process Doesnot exceed 3rd NSTWS - Canadian Pacific
Wind derailmentsTrain accident reduction strategies CP has experienced 4 derailments of empty double stack containers in the past 5 years at an average cost of $2 million/derailment. Current initiative to develop wind monitoring sites and communicate information to train operators 3rd NSTWS - Canadian Pacific
Nature of the hazard Four derailments • Carberry 42.15 Nov 1, 1999 • Maple Creek 13.8Dec 5, 2003 • Maple Creek 13.8Jan 22, 2005 • Adirondack Sub 41.9 Feb 17, 2006 Risk derailment is increasing at 7% annually 3rd NSTWS - Canadian Pacific
Carrberry Sub 42.15 (Antelope) derailment, Nov 1, 1999 Train, 38 mph @ 250 degrees Nov 1, 1999 Wind derailment Reported wind, 27 mph @ 130 degrees 3rd NSTWS - Canadian Pacific
Carberry Sub, Mile 42.15 Nov 1, 1999 3rd NSTWS - Canadian Pacific
Wind hazard notification systems - potential schemes Options 1. Track side anemometer – NMC (Network Management Centre (= NASA Mission Control)) – Train crew 2. Track side anemometer – Train crew 3. Train mounted wind load pressure cell – Train crew 3rd NSTWS - Canadian Pacific
NMC Trains Track side anemometers – NMC - train • Anemometer measures wind speed and direction • Anemometer sends message to NMC if thresholds are exceeded • NMC analyses wind direction and speed and determines location of wind sensitive trains in area • NMC directs wind sensitive trains to slow and stop in the nearest leeward siding Anemometer 3rd NSTWS - Canadian Pacific
Train mounted wind-load pressure cell • Wind sensitive load cell on the both sides of the locomotive • Red light or gauge in cab indicates when differential pressure is approaching blow over threshold • Train crew responds by slowing train and stopping in next leeward siding 3rd NSTWS - Canadian Pacific
Financial – Cost estimates • Track side anemometer to NMC to Train • $0.5 • 8 to 12 months • Train mounted pressure cells • $1.6M ($4,000/locomotive * 400 locomotives) • 12 to 48 months 3rd NSTWS - Canadian Pacific
Shuswap Sub, Mile 22.5June 13, 199022 mile West of Revelstoke, BC 3rd NSTWS - Canadian Pacific
CPR geotechnical weather studiesShuswap Sub, Mile 22.5June 13, 1990 3rd NSTWS - Canadian Pacific
Conclusions • Always want more data • Need weather service information providers to package information • Need criteria specifically tailored to railway infrastructure vulnerability to reduce false alarms 3rd NSTWS - Canadian Pacific
Thank you? Chris Bunce Manager – Geotechnical EngineeringCanadian Pacific chris_bunce@cpr.cawww.cpr.ca Have a safe journey home. It is the likely the most dangerous thing you’ll do to day. 3rd NSTWS - Canadian Pacific