Download
1 / 6
60 likes | 141 Views
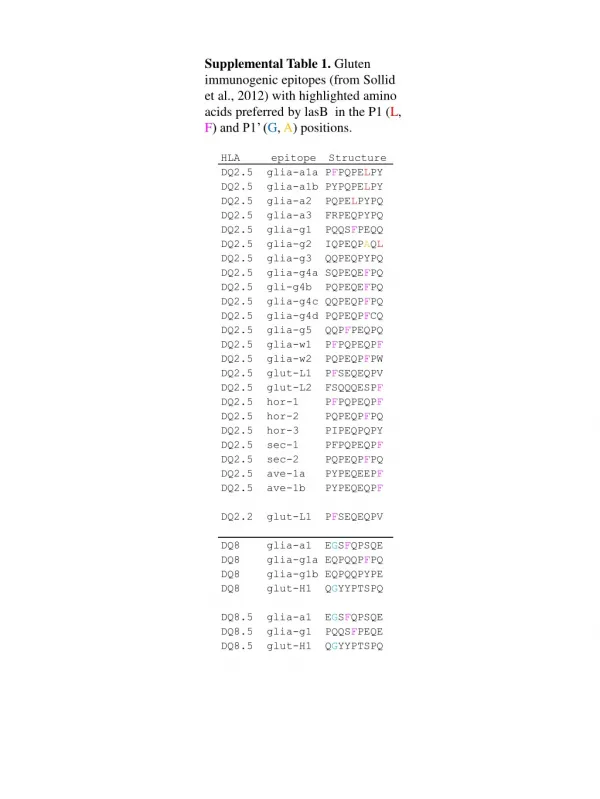
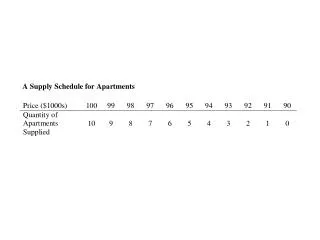
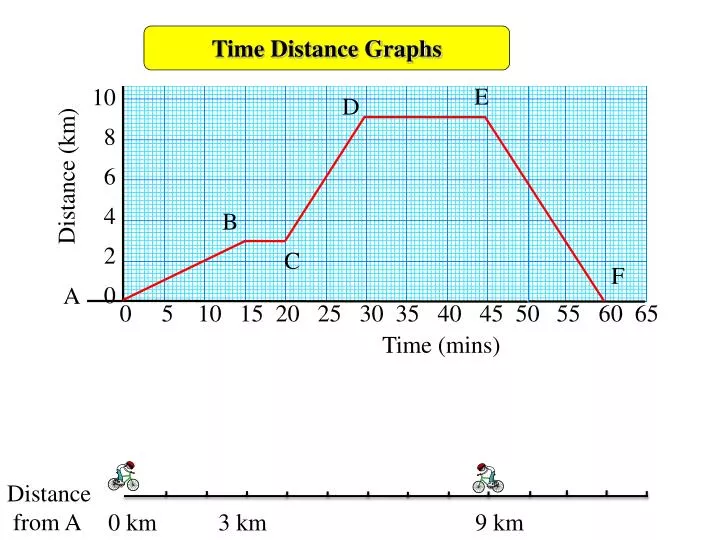
A. Time Distance Graphs. E. D. 10 9 8 7 10 8 6 4 2 0. 10 9 8 7 10 8 6 4 2 0. Distance (km). B. C. F. Time (mins). Distance from A. 0 km. 3 km. 9 km. 0 5 10 15 20 25 30 3 55 60 65.

E N D
A Time Distance Graphs E D 10 9 8 7 10 8 6 4 2 0 10 9 8 7 10 8 6 4 2 0 Distance (km) B C F Time (mins) Distance from A 0 km 3 km 9 km 0 5 10 15 20 25 30 3 55 60 65 0 5 10 15 20 25 30 35 40 45 50
Time Distance Graphs E D 10 9 8 7 10 8 6 4 2 0 10 9 8 7 10 8 6 4 2 0 Distance (km) B 3 C A F A is the start point Time (mins) A - B is the first part of the journey 3 km Read the distance from A on the y axis Read the time from A on the x axis 15 mins = 0.25 hrs Calculate the speed: S = D T S = 3 0.25 = 12 km/h 0 5 10 15 20 25 30 35 40 45 50 0 5 10 15 20 25 30 3 55 60 65
Time Distance Graphs E D 10 9 8 7 10 8 6 4 2 0 10 9 8 7 10 8 6 4 2 0 Distance (km) B 3 C A F Time (mins) B - C the distance from A did not change The cyclist was stopped for 5 minutes Horizontal line means stopped 0 5 10 15 20 25 30 35 40 45 50 0 5 10 15 20 25 30 3 55 60 65
Time Distance Graphs E D 10 9 8 7 10 8 6 4 2 0 10 9 8 7 10 8 6 4 2 0 Distance (km) B 3 C A F Time (mins) C - D the next part of the journey Notice that the gradient of the graph is steeper for C – D than for the section A – B. C - D is a longer distance (6 km) in a shorter time (10 mins) than A – B so the speed must have been faster. Steeper gradient means faster speed 0 5 10 15 20 25 30 35 40 45 50 0 5 10 15 20 25 30 3 55 60 65
Time Distance Graphs E D 10 9 8 7 10 8 6 4 2 0 10 9 8 7 10 8 6 4 2 0 Distance (km) B 3 C A F Time (mins) E - F the line returns to the x axis The cyclist went back to A The distance travelled was from A to 9 km away, then back again The total distance 18 km Calculate the average speed: S = D T S = 18 1 = 18 km/h 0 5 10 15 20 25 30 3 55 60 65 0 5 10 15 20 25 30 35 40 45 50
A Time Distance Graphs E D 10 9 8 7 10 8 6 4 2 0 10 9 8 7 10 8 6 4 2 0 Distance (km) B C F Time (mins) Distance from A 0 km 3 km 9 km 0 5 10 15 20 25 30 3 55 60 65 0 5 10 15 20 25 30 35 40 45 50