Download
1 / 13
130 likes | 134 Views
Learn about the increase in spider activity this season and explore spiders and other minibeasts through geography, science, and math activities. Engage students in spider research, data handling, measurement, and symmetry.

E N D
It’s in the News! Teacher’s guide In this issue of It’s in the News! we are looking at spiders and other minibeasts. At the beginning of September 2011, there was an item in the news informing us that this is spider season. This autumn there are reportedly more spiders invading our homes and gardens than ever before. Apparently this is because the summer was warm and damp, giving ideal conditions for spiders to breed. In these slides there are links to geography and science. If you do a topic on living things, particularly of the minibeast variety, you might find these slides helpful. If not, why not do it anyway, spiders always cause some sort of reaction from the children! The slides give opportunities for work on a variety of mathematical concepts such as number, data handling and measurement. … continued on the next slide
… continued Before you use the slides you might like to gen up on our eight-legged little friends! The following websites give further information: Guardian.co.uk spider season UK Safari Wikipedia Nick’s Spiders or Britain and Europe Top ten very deadliest spiders Minibeasts at pppst.com
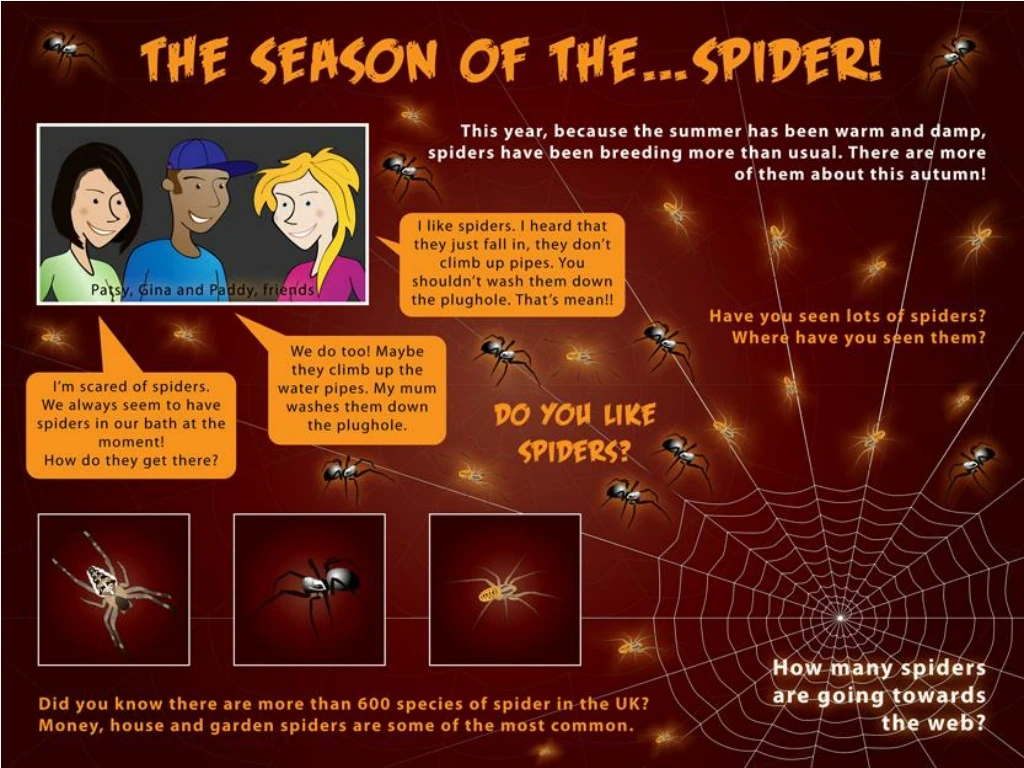
1st slide: The season of the…spider! ● Introduce the slides by talking about the weather conditions over the summer that have caused this unusual number of spiders. ● Ask the children the two questions above the spider’s web. You could make a tally to show whether they have seen any spiders recently. You could then use this as an opportunity to practice single criteria Venn and Carroll diagrams: seen spiders/not seen spiders. ● You could make a list of where they have spotted them. Then make a tally of these places and ask the children to make a pictogram, bar graph or pie chart to show this information. ● Ask the children if they like spiders. You could make Venn and Carroll diagrams to show this information: like spiders/do not like spiders. ● Discuss the comments of the children. Have they ever had spiders in their baths? If so what do they do to remove them. Apparently, they don’t climb up through the pipes and out of the plug hole, they just fall in. A kind way to help them out is to lay a towel down the side of the bath. They will climb up that. ● Refer to the fact that there are over 600 species of spider in the UK. Write 600 on the board and ask the children to find a variety of ways of making this number using addition, subtraction, multiplication and division as appropriate. You could also involve fractions, decimals and percentages. ● What can the children tell you about the number 600? You could use this as an opportunity to look at the rules of divisibility to find out what this number can be divided by. Is it a square number? A prime number? What is it the square root of? Of what numbers is it a multiple? …continued on the next slide
1st slide: The season of the…spider!continued… ● How many spiders are making their way to the web? Ask the children to estimate first and then to count. Discuss ways of counting them e.g. singly, in pairs, adding groups that they can subitize. ● You could use these spiders to practise number pairs to 10, 20 and 25, addition, subtraction, doubling and halving. ● You could also use this to practise the eight times table facts and corresponding divisions: six spiders, how many legs? 24 legs, how many spiders? ● For numbers above ten you could rehearse the grid method for multiplication and grouping: 23 spiders, how many legs? 152 legs, how many spiders? ● Use the spiders to practise ordinal numbers e.g. who might be first to the web? Second? Third? ● Ask the children to tell you all they know about spiders. You could list this information on the board. You could then ask them to research the three common spiders that are on the slide. They could make fact files for each one, ensuring that they find as much mathematical information as they can. …continued on the next slide
1st slide: The season of the…spider!continued… ● Once they have done this they could explore other UK spiders. They could find the size of ten and draw these to scale to visually compare them. ● You could give younger children plasticine and ask them to make a spherical body. Be sure to discuss the properties of a sphere. They could make legs out of pipe cleaners to create their own model spiders. ● Spiders are symmetrical. You could ask the children to draw half a spider, then give it to a partner for them to draw the other half. ● Focus on the web. Ask the children to imagine the threads are straight. Can they see where the triangles and trapeziums are? How many triangles would they be able to see inside one large triangle? ● Can they estimate how many small sections there are altogether? How could they find out for sure? What calculations would they need to make? ● Ask them to draw a copy of the web with straight line threads inside the spiral. They should use a ruler for this. They could then cut out the large triangles they make and rearrange all the pieces to make other shapes. What shapes can they make? Can they make a large quadrilateral? …continued on the next slide
1st slide: The season of the…spider!continued… ● You could ask them to explore angles. What angles are made by the threads coming out from the centre? They could estimate first and then use a protractor to check. What angles are made at the points where the threads cross. Are they all the same or similar? Do they vary considerably? ● You could give them centimetre squared paper and a copy of the web. You could then ask them to use the squared paper to estimate the area of the web. They could also explore perimeter or circumference. This could lead into work on approximate diameter and radius. ● As spiders’ webs are spiral, you could explore these. Ask the children to draw a spiral shape on paper. They then cut it out and see how far it spirals downwards. You could ask eight children to order themselves according to these lengths. Take the shortest spiral and ask the class to estimate its length. Next measure and compare with the estimates. Use the measurement of the shortest one to estimate the one beside it. Again measure and compare. Do this for all the spirals. This might help the children’s estimating skills.
2nd slide: The world’s top ten most deadly spiders ● Discuss the idea that spiders are all venomous and can bite, but, in the UK, most have mandibles that are not strong enough to break through human skin. Ensure the children know what the words venomous and mandibles mean. Some spiders are deadly and can kill mammals and make people very sick. ● Look at the spiders on the slide and together identify the countries on the map where each of them are found. Which countries are the South American countries? You could compare the areas of the different countries by looking at them. You could make a copy of the map and ask children to cut out certain countries. They could then cut these into pieces and rearrange to make squares or rectangles. They could then compare the different countries’ areas by comparing the areas of the squares or rectangles. ● You could give copies of the map to children to work out the distances from parts of the UK to parts of the countries. If they have done this on previous It’s in the news! slides they should be really proficient at this! If not, let them measure using string or a ruler and then convert the distance according to the scale on the map. ● They could find average rainfall and temperatures of the different countries and see if they can find any commonalities with the countries and the climate the different spiders enjoy. ● They could imagine that they are arachnid experts and want to observe the habits of a particular deadly spider. They could plan their trip to the appropriate country. They will need to take into account costs of travel and accommodation, what they would need to take and the time it will take to travel, stay and return. ● The children could research each spider and make a database as suggested in the ICT article in this issue and Issue 29 of the Primary Magazine. They should use as much mathematical data as they can find, plus other interesting pieces of information. They could write these on cards and then sort them according to different criteria.
3rd slide: Other minibeasts ● Discuss the characteristics of a minibeast ensuring that you include the information mentioned on the slide. ● Ask what the butterflies, bees and ladybirds have in common. Agree that they are all insects. You could go into more detail about the body make up and life cycles of these. Ask the children to make a list of the other insects they know of. ● You could go into more detail about the other types of creature. Maybe the children could use the internet to find out what types of animals they are and jot down their species’ characteristics. ● Use the slide for some counting e.g. how many insects altogether? What would be a good estimate for the number of worms? Why is it impossible to know exactly? How many more woodlice than slugs/snails? How many stones can you see? Is this an estimate or the actual number? ● You could ask questions involving finding number pairs e.g. how many more butterflies are needed to make 12. You could also ask questions involving the four operations and doubling and halving. ● Agree that most of these creatures are symmetrical. You could give them the opportunity to make a butterfly painting by making a pattern using paint on one half of a piece of paper, folding it in half and pressing hard so that the pattern appears on the other half. When it is dry they fold it again and cut out half a butterfly shape. When it is opened they will have a symmetrical butterfly. ● You could ask them to draw a ladybird and colour or paint it. They could then add the spots. These are symmetrically arranged on a real ladybird, so make sure the children’s are. …continued on the next slide
3rd slide: Other minibeastscontinued… ● You could play the ladybird game as described in the primary section of ‘What makes a good resource’ . ● Give each child a small piece of plasticine. Give them 30 seconds to roll it into the longest worm they can. In small groups, ask them to order their worms from shortest to longest. They then estimate the length of the shortest worm and write this down on paper. They then measure it with a ruler and compare this with their estimate. Who was the closest? They use this measurement to estimate the next worm and so on rather like the spiral making suggestion. ● You could use the slide for some data handling, making Venn or Carroll diagrams with two criteria e.g. antennae/no antennae and legs/no legs. You could encourage them to think of their own criteria. They could also do this using a decision tree diagram. ● You could also ask them to create decision tree diagrams to work out what a minibeast is. Here are some useful links that might help: naturegrid.org.uk/ sebastianswan.org.uk ngfl-cymru.org.uk/ ● You could ask them to research each creature and find information that you agree on as a class. The children could then make databases to sort as mentioned for the spiders. ● You could take the children outside for a minibeast hunt. They should record the numbers of different ones that they can see, making a tally to do this. Once back in class they could display the information on their tally using pictograms, bar graphs or pie charts. Ask them to make up some problems to show when and why this information might be helpful. …continued on the next slide
3rd slide: Other minibeastscontinued… ● You could do this at different times during the day, logging the time of each hunt. Were there more popular times of the day than others when the creatures appeared? If so when? Was it the same for all? They could display this information by drawing and annotating the times on analogue and digital clocks . ● Discuss where they saw the creatures they found. Which was the most popular place? There are numerous possibilities for mathematical work around this topic. We hope this has given you a few ideas.