Download
1 / 1
10 likes | 118 Views
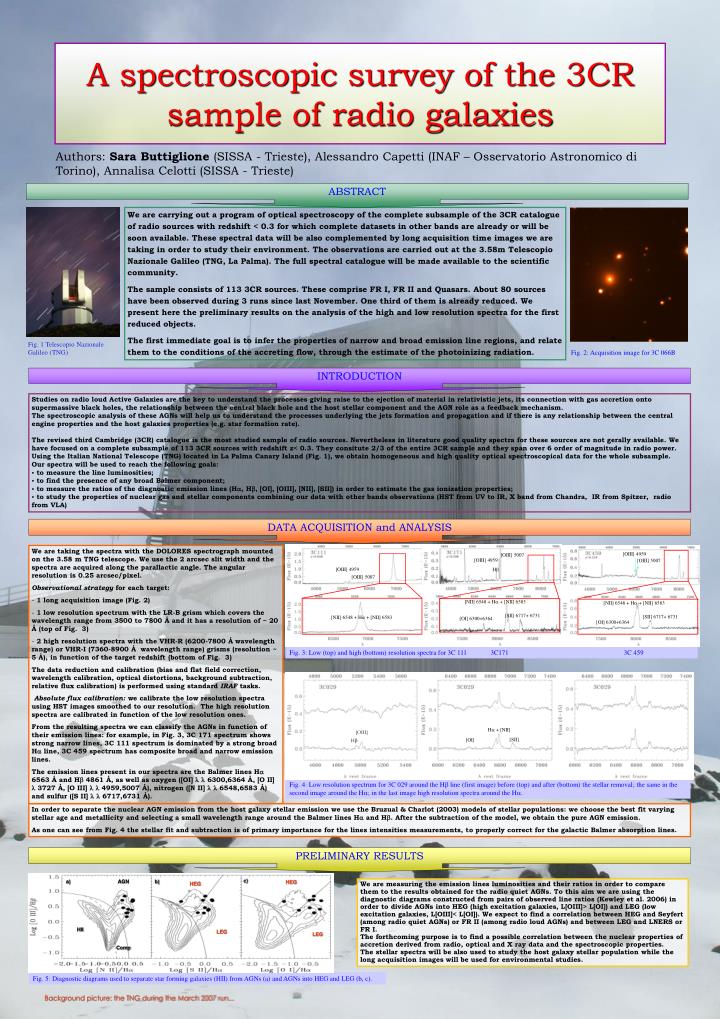
[OIII]. H b. A spectroscopic survey of the 3CR sample of radio galaxies. Authors: Sara Buttiglione (SISSA - Trieste), Alessandro Capetti (INAF – Osservatorio Astronomico di Torino), Annalisa Celotti (SISSA - Trieste). ABSTRACT.

E N D
[OIII] Hb A spectroscopic survey of the 3CR sample of radio galaxies Authors: Sara Buttiglione (SISSA - Trieste), Alessandro Capetti (INAF – Osservatorio Astronomico di Torino), Annalisa Celotti (SISSA - Trieste) ABSTRACT We are carrying out a program of optical spectroscopy of the complete subsample of the 3CR catalogue of radio sources with redshift < 0.3 for which complete datasets in other bands are already or will be soon available. These spectral data will be also complemented by long acquisition time images we are taking in order to study their environment. The observations are carried out at the 3.58m Telescopio Nazionale Galileo (TNG, La Palma). The full spectral catalogue will be made available to the scientific community. The sample consists of 113 3CR sources. These comprise FR I, FR II and Quasars. About 80 sources have been observed during 3 runs since last November. One third of them is already reduced. We present here the preliminary results on the analysis of the high and low resolution spectra for the first reduced objects. The first immediate goal is to infer the properties of narrow and broad emission line regions, and relate them to the conditions of the accreting flow, through the estimate of the photoinizing radiation. Fig. 1 Telescopio Nazionale Galileo (TNG) Fig. 2: Acquisition image for 3C 066B INTRODUCTION Studies on radio loud Active Galaxies are the key to understand the processes giving raise to the ejection of material in relativistic jets, its connection with gas accretion onto supermassive black holes, the relationship between the central black hole and the host stellar component and the AGN role as a feedback mechanism. The spectroscopic analysis of these AGNs will help us to understand the processes underlying the jets formation and propagation and if there is any relationship between the central engine properties and the host galaxies properties (e.g. star formation rate). The revised third Cambridge (3CR) catalogue is the most studied sample of radio sources. Nevertheless in literature good quality spectra for these sources are not gerally available. We have focused on a complete subsample of 113 3CR sources with redshift z< 0.3. They consitute 2/3 of the entire 3CR sample and they span over 6 order of magnitude in radio power. Using the Italian National Telescope (TNG) located in La Palma Canary Island (Fig. 1), we obtain homogeneous and high quality optical spectroscopical data for the whole subsample. Our spectra will be used to reach the following goals: • to measure the line luminosities; • to find the presence of any broad Balmer component; • to measure the ratios of the diagnostic emission lines (Ha, Hb, [OI], [OIII], [NII], [SII]) in order to estimate the gas ionization properties; • to study the properties of nuclear gas and stellar components combining our data with other bands observations (HST from UV to IR, X band from Chandra, IR from Spitzer, radio from VLA) DATA ACQUISITION and ANALYSIS We are taking the spectra with the DOLORES spectrograph mounted on the 3.58 m TNG telescope. We use the 2 arcsec slit width and the spectra are acquired along the parallactic angle. The angular resolution is 0.25 arcsec/pixel. Observational strategy for each target: • 1 long acquisition image (Fig. 2) • 1 low resolution spectrum with the LR-B grism which covers the wavelength range from 3500 to 7800 Å and it has a resolution of ~ 20 Å (top of Fig. 3) • 2 high resolution spectra with the VHR-R (6200-7800 Å wavelength range) or VHR-I (7360-8900 Å wavelength range) grisms (resolution ~ 5 Å), in function of the target redshift (bottom of Fig. 3) The data reduction and calibration (bias and flat field correction, wavelength calibration, optical distortions, background subtraction, relative flux calibration) is performed using standard IRAF tasks. Absolute flux calibration:we calibrate the low resolution spectra using HST images smoothed to our resolution. The high resolution spectra are calibrated in function of the low resolution ones. From the resulting spectra we can classify the AGNs in function of their emission lines: for example, in Fig. 3, 3C 171 spectrum shows strong narrow lines, 3C 111 spectrum is dominated by a strong broad Ha line, 3C 459 spectrum has composite broad and narrow emission lines. The emission lines present in our spectra are the Balmer lines H 6563 Å and H 4861 Å, as well as oxygen ([OI] 6300,6364 Å, [O II] 3727 Å, [O III] l 4959,5007 Å), nitrogen ([N II] 6548,6583 Å) and sulfur ([S II] 6717,6731 Å). [OIII] 4959 [OIII] 5007 [OIII] 4959 [OIII] 5007 [OIII] 4959 Hb [OIII] 5007 [NII] 6548 +Ha + [NII] 6583 [NII] 6548 +Ha + [NII] 6583 [SII] 6717+ 6731 [SII] 6717+ 6731 [NII] 6548 +Ha + [NII] 6583 [OI] 6300+6364 [OI] 6300+6364 Fig. 3: Low (top) and high (bottom) resolution spectra for 3C 111 3C171 3C 459 Ha + [NII] [SII] [OI] Fig. 4: Low resolution spectrum for 3C 029 around the Hb line (first image) before (top) and after (bottom) the stellar removal; the same in the second image around the Ha; in the last image high resolution spectra around the Ha. In order to separate the nuclear AGN emission from the host galaxy stellar emission we use the Bruzual & Charlot (2003) models of stellar populations: we choose the best fit varying stellar age and metallicity and selecting a small wavelength range around the Balmer lines H and H. After the subtraction of the model, we obtain the pure AGN emission. As one can see from Fig. 4 the stellar fit and subtraction is of primary importance for the lines intensities measurements, to properly correct for the galactic Balmer absorption lines. PRELIMINARY RESULTS c) a) AGN b) We are measuring the emission lines luminosities and their ratios in order to compare them to the results obtained for the radio quiet AGNs. To this aim we are using the diagnostic diagrams constructed from pairs of observed line ratios (Kewley et al. 2006) in order to divide AGNs into HEG (high excitation galaxies, L[OIII]> L[OI]) and LEG (low excitation galaxies, L[OIII]< L[OI]). We expect to find a correlation between HEG and Seyfert (among radio quiet AGNs) or FR II (among radio loud AGNs) and between LEG and LNERS or FR I. The forthcoming purpose is to find a possible correlation between the nuclear properties of accretion derived from radio, optical and X ray data and the spectroscopic properties. The stellar spectra will be also used to study the host galaxy stellar population while the long acquisition images will be used for environmental studies. HEG HEG HII LEG LEG Comp Fig. 5: Diagnostic diagrams used to separate star forming galaxies (HII) from AGNs (a) and AGNs into HEG and LEG (b, c). Background picture: the TNG during the March 2007 run...