Download
1 / 44
480 likes | 1.05k Views
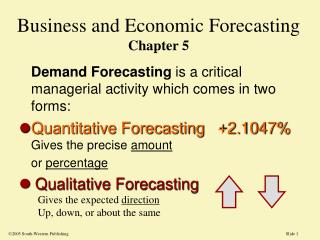
Chapter 5 Forecasting. Prepared by Lee Revere and John Large. Learning Objectives. Students will be able to: Understand and know when to use various families of forecasting models. Compare moving averages, exponential smoothing, and trend time-series models. Seasonally adjust data.

E N D
Chapter 5 Forecasting Prepared by Lee Revere and John Large 5-1
Learning Objectives Students will be able to: • Understand and know when to use various families of forecasting models. • Compare moving averages, exponential smoothing, and trend time-series models. • Seasonally adjust data. • Understand Delphi and other qualitative decision-making approaches. • Compute a variety of error measures. 5-2
Chapter Outline 5.1 Introduction 5.2 Types of Forecasts 5.3 Scatter Diagrams and Time Series 5.4 Measures of Forecast Accuracy 5.5 Time-Series Forecasting Models 5.6 Monitoring and Controlling Forecasts 5.7 Using the Computer to Forecast 5-3
Introduction Eight steps to forecasting: • Determine the use of the forecast. • Select the items or quantities to be forecasted. • Determine the time horizon of the forecast. • Select the forecasting model or models. • Gather the data needed to make the forecast. • Validate the forecasting model. • Make the forecast. • Implement the results. These steps provide a systematic way of initiating, designing, and implementing a forecasting system. 5-4
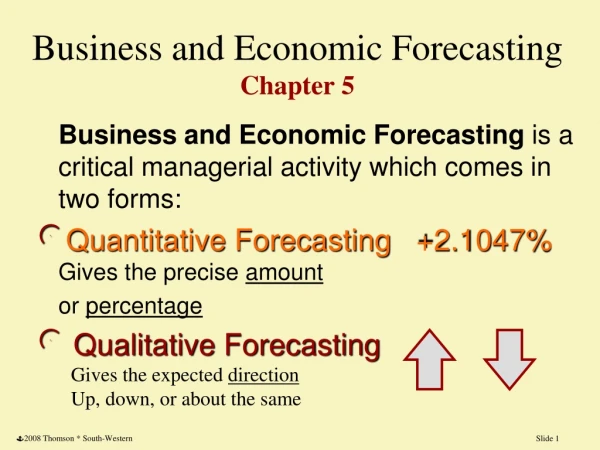
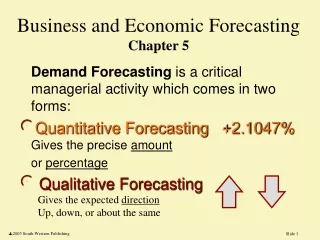
Types of Forecasts Forecasting Techniques No single method is superior Qualitative Models: attempt to include subjective factors Causal Methods:include a variety of factors Time-Series Methods:include historical data over a time interval Delphi Methods Moving Average Regression Analysis Multiple Regression Jury of Executive Opinion Exponential Smoothing Trend Projections Sales Force Composite Decomposition Consumer Market Survey 5-5
Qualitative Methods • Delphi Methodinteractive group process consisting of obtaining information from a group of respondents through questionnaires and surveys • Jury of Executive Opinionobtains opinions of a small group of high-level managers in combination with statistical models • Sales Force Compositeallows each sales person to estimate the sales for his/her region and then compiles the data at a district or national level • Consumer Market Surveysolicits input from customers or potential customers regarding their future purchasing plans 5-6
Scatter Diagrams Scatter diagrams are helpful when forecasting time-series data because they depict the relationship between variables. Radios Televisions Compact Discs 5-7
Measures of Forecast Accuracy Forecast errors allow one to see how well the forecast model works and compare that model with other forecast models. Forecast error = actual value – forecast value 5-8
Measures of Forecast Accuracy (continued) Measures of forecast accuracy include: • Mean Absolute Deviation (MAD) • Mean Squared Error (MSE) • Mean Absolute Percent Error (MAPE) = å |forecast errors| n 2 = å (errors) n = åactual n error 100% 5-9
Hospital Days – Forecast Error Example Ms. Smith forecasted total hospital inpatient days last year. Now that the actual data are known, she is reevaluating her forecasting model. Compute the MAD, MSE, and MAPE for her forecast. 5-10
Hospital Days – Forecast Error Example MAD = MSE = MAPE= .0368*100 = 5-11
Decomposition of a Time-Series Time series can be decomposed into: • Trend (T): gradual up or down movement over time • Seasonality (S): pattern of fluctuations above or below trend line that occurs every year • Cycles(C): patterns in data that occur every several years • Random variations (R): “blips”in the data caused by chance and unusual situations 5-12
Components of Decomposition Actual Data Trend Cyclic Random 5-13
Decomposition of Time-Series: Two Models Multiplicative modelassumes demand is the product of the four components. demand = T * S * C * R Additive modelassumes demand is the summation of the four components. demand = T + S + C + R 5-14
Moving Averages Moving average methods consist of computing an average of the most recent n data values for the time series and using this average for the forecast of the next period. Simple moving average = å demand in previous n periods n 5-15
Month Actual Shed Sales Three-Month Moving Average January 10 February 12 March 13 April 16 (10+12+13)/3 = 11 2/3 May 19 (12+13+16)/3 = 13 2/3 June 23 (13+16+19)/3 = 16 July 26 (16+19+23)/3 = 19 1/3 Wallace Garden Supply’s Three-Month Moving Average 5-16
Weighted Moving Averages Weighted moving averages use weights to put more emphasis on recent periods. Weighted moving average = • (weight for period n) (demand in period n)∑ weights 5-17
2*Sales two months ago + Calculating Weighted Moving Averages Weights Applied Period Last month 3 Two months ago 2 Three months ago 1 3*Sales last month + 1*Sales three months ago Sum of weights 6 5-18
Month Actual Three-Month Weighted Moving Average Shed Sales January 10 February 12 March 13 [3*13+2*12+1*10]/6 = 12 1/6 April 16 [3*16+2*13+1*12]/6 =14 1/3 May 19 [3*19+2*16+1*13]/6 = 17 June 23 [3*23+2*19+1*16]/6 = 20 1/2 July 26 Wallace Garden’s Weighted Three-Month Moving Average 5-19
Exponential Smoothing Exponential smoothing is a type of moving average technique that involves little record keeping of past data. New forecast = previous forecast + (previous actual –previous forecast) Mathematically this is expressed as: Ft = Ft-1 + (Yt-1 - Ft-1) Ft = new forecast Ft-1 = previous forecast = smoothing constant Yt-1 = previous period actual 5-20
Selecting a Smoothing Constant To select the best smoothing constant, evaluate the accuracy of each forecasting model. The lowest MAD results from = 0.10 5-23
PM Computer: Moving Average Example • PM Computer assembles customized personal computers from generic parts. • The owners purchase generic computer parts in volume at a discount from a variety of sources whenever they see a good deal. • It is important that they develop a good forecast of demand for their computers so they can purchase component parts efficiently. 5-24
PM Computers: Data Periodmonthactual demand 1 Jan 37 2 Feb 40 3 Mar 41 4 Apr 37 5 May 45 6 June 50 7 July 43 8 Aug 47 9 Sept 56 • Compute a 2-month moving average • Compute a 3-month weighted average using weights of 4,2,1 for the past three months of data • Compute an exponential smoothing forecast using = 0.7 • Using MAD, what forecast is most accurate? 5-25
PM Computers: Moving Average Solution MAD Exponential smoothing resulted in the lowest MAD. 5-26
Exponential Smoothing with Trend Adjustment • Simple exponential smoothing - first-order smoothing • Trend adjusted smoothing - second-order smoothing • Low gives less weight to more recent trends, while high gives higher weight to more recent trends. Simple exponential smoothing fails to respond to trends, so a more complex model is necessary with trend adjustment. 5-27
Exponential Smoothing with Trend Adjustment Forecast including trend (FITt+1) = new forecast (Ft) + trend correction(Tt) Tt = (1 - )Tt-1 + (Ft – Ft-1) where • Ti = smoothed trend for period 1 • Ti-1 = smoothed trend for the preceding period • = trend smoothing constant Ft = simple exponential smoothed forecast for period t Ft-1 = forecast for period t-1 5-28
Trend Projection Trend projections are used to forecast time-series data that exhibit a linear trend. • Least squares may be used to determine a trend projection for future forecasts. • Least squares determines the trend line forecast by minimizing the mean squared error between the trend line forecasts and the actual observed values. • The independent variable is the time period and the dependent variable is the actual observed value in the time series. 5-29
Trend Projection (continued) The formula for the trend projection is: Y= b + b X where: Y = predicted value b1 = slope of the trend line b0 = intercept X = time period (1,2,3…n) 0 1 5-30
Midwestern Manufacturing Trend Projection Example Midwestern Manufacturing Company’s demand for electrical generators over the period of 1996 – 2000 is given below. 5-31
Midwestern Manufacturing Company Trend Solution Sales = 56.71 + 10.54 (time) 5-32
Midwestern Manufacturing’s Trend Trend Line Forecast points Actual demand line 5-33
Seasonal Variations Seasonal indices can be used to make adjustments in the forecast for seasonality. • A seasonal index indicates how a particular season compares with an average season. • The seasonal index can be found by dividing the average value for a particular season by the average of all the data. 5-34
Average Average Month Sales Demand Seasonal Two-Year Monthly Index Demand Demand Year 1 Year 2 Jan 90 94 0.957 80 100 Feb 75 85 80 94 0.851 Mar 80 90 85 94 0.904 Apr 90 110 100 94 1.064 May 115 131 123 94 1.309 … … … … … … Total Average Demand 1,128 Seasonal Index: = Average 2 -year demand/Average monthly demand Eichler Supplies: Seasonal Index Example 5-35
Seasonal Variations with Trend Centered Moving Average (CMA) is an approach that prevents a variation due to trend from being incorrectly interpreted as a variation due to the season. Steps of Multiplicative Time-Series Model1. Compute the CMA for each observation. • Compute seasonal ratio (observation/CMA). 3. Average seasonal ratios to get seasonal indices. 4. If seasonal indices do not add to the number of seasons, multiply each index by (number of seasons)/(sum of the indices). 5-36
Turner IndustriesSeasonal Variations with Trend Turner Industries’ sales figures are shown below with the CMA and seasonal ratio. CMA (qtr 3 / yr 1 ) = .5(108) + 125 + 150 + 141+ .5(116) 4 Seasonal Ratio = Sales Qtr 3 = 150 CMA 132 5-37
Decomposition Method with Trend and Seasonal Components Decomposition is the process of isolating linear trend and seasonal factors to develop more accurate forecasts. There are five steps to decomposition:1. Compute the seasonal index for each season.2. Deseasonalize the data by dividing each number by its seasonal index. 3. Compute a trend line with the deseasonalized data. 4. Use the trend line to forecast. 5. Multiply the forecasts by the seasonal index. 5-38
Turner Industries: Decomposition Method Turner Industries has noticed a trend in quarterly sales figures. There is also a seasonal component. Below is the seasonal index and deseasonalized sales data. * 108 0.85 = Seasonal Index for Qtr 1 = 0.851+0.848 = 0.85 2 • This value is derived by averaging the season rations for each quarter. • Refer to slide 5-37. 5-39
Turner Industries: Decomposition Method Using the deseasonalized data, the following trend line was computed: Sales = 124.78 + 2.34X 5-40
Turner Industries: Decomposition Method Using the trend line, the following forecast was computed: Sales = 124.78 + 2.34X For period 13 (quarter 1/ year 4): Sales = 124.78 + 2.34 (13) = 155.2 (before seasonality adjustment) After seasonality adjustment: Sales = 155.2 (0.85) = 131.92 Seasonal index for quarter 1 5-41
Multiple Regression with Trend and Seasonal Components Multiple regression can be used to develop an additive decomposition model. • One independent variable is time. • Seasons are represented by dummy independent variables. Y = a + b X + b X + b X + b X Where X = time period X = 1 if quarter 2 = 0 otherwise X = 1 if quarter 3 = 0 otherwise X = 1 if quarter 4 = 0 otherwise 1 1 2 2 3 3 4 4 1 2 3 4 5-42
Monitoring and Controlling Forecasts Tracking signalsmeasure how well predictions fit actual data. 5-43