Download
1 / 1
10 likes | 92 Views
CAR. PHL. QUE. Using Chromatography to Select Effective Biomineral Growth Modifiers Tissa J. Thomas and Ryan E. Sours Department of Chemistry, Towson University, Towson, MD 21252, USA. Introduction. Results. Discussion.

E N D
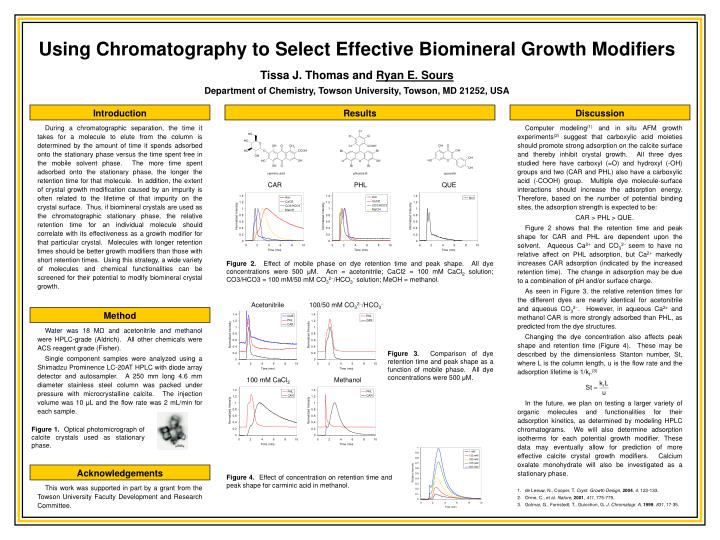
CAR PHL QUE Using Chromatography to Select Effective Biomineral Growth ModifiersTissa J. Thomas and Ryan E. SoursDepartment of Chemistry, Towson University, Towson, MD 21252, USA Introduction Results Discussion Computer modeling(1) and in situ AFM growth experiments(2) suggest that carboxylic acid moieties should promote strong adsorption on the calcite surface and thereby inhibit crystal growth. All three dyes studied here have carboxyl (=O) and hydroxyl (-OH) groups and two (CAR and PHL) also have a carboxylic acid (-COOH) group. Multiple dye molecule-surface interactions should increase the adsorption energy. Therefore, based on the number of potential binding sites, the adsorption strength is expected to be: CAR > PHL > QUE. Figure 2 shows that the retention time and peak shape for CAR and PHL are dependent upon the solvent. Aqueous Ca2+ and CO32 seem to have no relative affect on PHL adsorption, but Ca2+ markedly increases CAR adsorption (indicated by the increased retention time). The change in adsorption may be due to a combination of pH and/or surface charge. As seen in Figure 3, the relative retention times for the different dyes are nearly identical for acetonitrile and aqueous CO32. However, in aqueous Ca2+ and methanol CAR is more strongly adsorbed than PHL, as predicted from the dye structures. Changing the dye concentration also affects peak shape and retention time (Figure 4). These may be described by the dimensionless Stanton number, St, where L is the column length, u is the flow rate and the adsorption lifetime is 1/kf.(3) In the future, we plan on testing a larger variety of organic molecules and functionalities for their adsorption kinetics, as determined by modeling HPLC chromatograms. We will also determine adsorption isotherms for each potential growth modifier. These data may eventually allow for prediction of more effective calcite crystal growth modifiers. Calcium oxalate monohydrate will also be investigated as a stationary phase. During a chromatographic separation, the time it takes for a molecule to elute from the column is determined by the amount of time it spends adsorbed onto the stationary phase versus the time spent free in the mobile solvent phase. The more time spent adsorbed onto the stationary phase, the longer the retention time for that molecule. In addition, the extent of crystal growth modification caused by an impurity is often related to the lifetime of that impurity on the crystal surface. Thus, if biomineral crystals are used as the chromatographic stationary phase, the relative retention time for an individual molecule should correlate with its effectiveness as a growth modifier for that particular crystal. Molecules with longer retention times should be better growth modifiers than those with short retention times. Using this strategy, a wide variety of molecules and chemical functionalities can be screened for their potential to modify biomineral crystal growth. Figure 2. Effect of mobile phase on dye retention time and peak shape. All dye concentrations were 500 μM. Acn = acetonitrile; CaCl2 = 100 mM CaCl2 solution; CO3/HCO3 = 100 mM/50 mM CO32/HCO3 solution; MeOH = methanol. Acetonitrile 100/50 mM CO32/HCO3 Method Water was 18 MΩ and acetonitrile and methanol were HPLC-grade (Aldrich). All other chemicals were ACS reagent grade (Fisher). Single component samples were analyzed using a Shimadzu Prominence LC-20AT HPLC with diode array detector and autosampler. A 250 mm long 4.6 mm diameter stainless steel column was packed under pressure with microcrystalline calcite. The injection volume was 10 μL and the flow rate was 2 mL/min for each sample. Figure 3. Comparison of dye retention time and peak shape as a function of mobile phase. All dye concentrations were 500 μM. 100 mM CaCl2 Methanol Figure 1. Optical photomicrograph of calcite crystals used as stationary phase. Acknowledgements Figure 4. Effect of concentration on retention time and peak shape for carminic acid in methanol. This work was supported in part by a grant from the Towson University Faculty Development and Research Committee. • de Leeuw, N., Cooper, T. Cryst. Growth Design,2004, 4, 123-133. • Orme, C., et al. Nature, 2001, 411, 775-779. • Gotmar, G., Fornstedt, T., Guiochon, G. J. Chromatogr. A, 1999, 831, 17-35.


