Download
1 / 36
380 likes | 502 Views
Topic 5 – Transportation and Urban Sustainability. A - The Concept of Urban Sustainability B - Sustainable Urban Transportation. The Concept of Urban Sustainability. A. 1. Sustainability 2. Global Sustainability 3. Urban Sustainability 4. Infrastructure, Land Use and Sustainability.

E N D
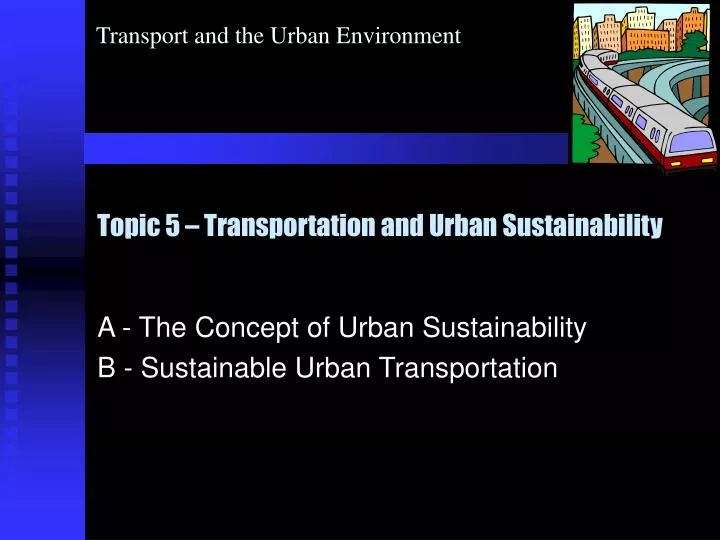
Topic 5 – Transportation and Urban Sustainability A - The Concept of Urban Sustainability B - Sustainable Urban Transportation
The Concept of Urban Sustainability A • 1. Sustainability • 2. Global Sustainability • 3. Urban Sustainability • 4. Infrastructure, Land Use and Sustainability
Sustainability A-1 • The issue • Brought forward in view of challenges in a scale never seen before. • Strong population growth, notably in the developing world. • An increasing usage of resources, renewable and non renewable alike. • Raw materials. • Energy. • Food. • Higher levels of emission of pollutants. • The capacity of this world to sustain its population is compromised
Sustainability A-1 • Global environmentalism • Ideology grew out of the 1972 UN Conference on the Human Environment, known as the Stockholm Conference. • Key event in the emergence of a global environmental movement. • Environmental issues are at the global scale. • Establish the linkage between poverty and environmental degradation. • Definition • Underlined by the Brundtland Commission in 1987: • “development which meets the needs of the present without compromising the ability of future generations to meet their own needs”. • Satisfy the needs of the population.
Sustainability A-1 • Limits imposed by the environment for those needs. • Newman and Kenworthy: • “in a global context any economic or social development should improve, not harm, the environment.” • Capacity of a system to accommodate changes. • Rates of use of renewable resources should not exceed their rates or regeneration. • Rates of use of non-renewable resources should not exceed at which renewable substitutes are developed. • Rates of pollution emissions do not exceed the assimilative capacity of the environment.
Sustainability A-1 • Impacts • Possible to measure the general impacts of human activities on the environment. • Impacts (I) = P*A*T • Where P is population, A is affluence (level of consumption) and T is technology. • The impacts must be lower than the carrying capacity of the world.
Global Sustainability A-2 • Achieved through the elimination of poverty • Poverty as a factor linked to environmental degradation. • Wealth reduces the population growth rate. • Achieved through the reduction in resource consumption and production of wastes • An American consumes 50 times more resources than an Indian. • The current level of resource consumption of development countries CANNOT be generalized. • Achieved through global cooperation • Environmental issues are global. • A globalized economy involves interdependencies.
Global Sustainability A-2 • Achieved at the local and regional level • Most of the problems occur at that level. • The urban area is at the root of the issue.
Global Sustainability • Sustain economic growth • Maximize profit • Expand markets • Externalize costs Economic Development Conservationism Socialism Ecological Development Social Development • Respect carrying capacity • Conserve and recycleresources • Reduce waste • Satisfy needs • Increase self-reliance Ecologism A-2
CO2 Emissions for the Transport Sector (in millions tons), United States and China, 1996 A-2
Urban Sustainability A-3 • Definition • Offer to its population a suitable urban environment, employment, food, housing and transportation. • Without compromising the welfare of the future population of that city. • Without compromising the welfare of its surrounding areas. • Little environmental damage, a good conservation of resources such as water, land and energy and the capability of handling change. • Intergenerational equity • The success of cities of the future will largely depend upon the legacy on current cities on resources and the environment. • National capital assets passed on to the next generation must be at least equal value.
Urban Sustainability A-3 • Social equity • Fair and equitable distribution of resources among the current generation. • The city should provide a place of equal opportunity and not be an agent of segregation. • Spatial responsibility • Involves that the city has a “footprint” is which considerably larger than the area it occupies. • Includes supply of resource, but also wastes and their impacts must be considered in the total space a city occupies.
Urban Sustainability A-3 • Spatial differences • Do not contribute to environmental problems at the same level. • Differences mainly the developed and the developing world • Cities of developed world consume 70% of the world’s energy, 75% of minerals and 85% of the wood. • Scale • Global: Long term stability of the earth’s environment. • Local: Degradation of urban life due to congestion and pollution with socio-economic consequences.
Urban Metabolism A-4 • Analogy • The city is a system. • Inputs of energy and raw materials. • Process the energy and raw materials with labor and infrastructure. • Outputs of products, services and wastes. • Offers conditions (opportunities) to support its working conditions and insure its growth. • Fast growth can be seen as a disease (cancer). • Sustainability achieved through the reduction of inputs and outputs.
Urban Metabolism • Health • Employment • Income • Education • Housing • Leisure • Mobility • Community Livability Resource Input Process Waste Outputs • Transport system • Economic system • Social system • Land • Water • Food • Energy • Construction materials • Other resources • Solid waste • Liquid waste • Air pollutants • Heat • Noise A-4
The Sears Tower, Chicago A-4 • Features • Enclosed entity. • 1,700 feet high. • 110 stories. • 10,000 workers. • Energy • Consumes more energy than an American city of 150,000. • Consumes more energy than an Indian city of 1 million.
Urban Metabolism A-4 • Urban footprint • Amount of land required to sustain the functions of a city. • Includes the provision of raw materials and the process of waste products. • Calculating the footprint • Keep track of most of the resources consumed and the wastes generated. • Converted to a biologically productive area necessary to provide these functions. • The footprint is not a continuous piece of land. • Due to international trade, the land and water areas used by most global citizens are scattered all over the planet.
The Urban Footprint of London (yearly figures) A-4 3.9 million tons of household andcommercial wastes 20 million tons of fuel 11.4 million tons of industrial and demolition wastes 40 million tons of oxygen 60 million tons of CO2 400,000 tons of SO2 280,000 tons of NO2 1 billion tons of water 2.4 million tons of food 15 million tons of raw materials
The Urban Footprint of London A-4 Carbon sequestration, 1.5 hectares per person, 10.5 million hectares Wood products, 768,000 hectares London, Population 7 millions, 158,000 hectares Food production, 0.2 hectares per person, 8.4 million hectares Total: 19.7 million hectares, 125 times the surface of the city
Infrastructure, Land Use and Sustainability A-5 • Context • Major cities are requiring a vast array of supporting infrastructures including energy, water, sewers and transport. • Key in urban sustainability issues is linked with the provision and maintenance of a wide range of urban infrastructure. • Every city has specific infrastructure and environmental problems. • Third World cities have chronic deficiencies in the provision of the most basic infrastructure while their environmental conditions are deteriorating. • Huge costs linked to this.
Infrastructure, Land Use and Sustainability A-5 • Infrastructure • Public utilities. • Including power, telecommunications, piped water supply, sewage, waste collection and disposal and piped gas. • Public work. • Including public transit, roads and transport terminals (ports, rail stations, airports). • Infrastructures can be public or privately owned. • Public infrastructures are available to a larger share of the population at a low cost. • Are expensive for the government to maintain. • Private infrastructures are only servicing a limited share of the population.
Infrastructure, Land Use and Sustainability A-5 • Choice of the infrastructure company, but are financially profitable. • As income increase, some infrastructure problems are solved while some environmental problems are created. • An increase in income is linked to better sanitation and water provision. • At the expense of waste and carbon dioxide emissions. • Land use • Another important part of urban sustainability is land use, which is how a city uses the territory. • Huge differences are observed the urban land use over the world, and this has impact on energy consumption.
Density and Energy Consumption A-5 80 Houston Phoenix United States Detroit Denver 60 Los Angeles Chicago New York Melbourne Energy consumption per capita (1,000 millions of joules) 40 Australia and Canada Adelaide Europe Sydney Paris Toronto Asia 20 Berlin Tokyo Singapore London Vienna Hong Kong 20 40 60 80 100 300 Population density (people per hectare)
Sustainable Transportation B • 1- Unsustainable Transportation • 2- General Indicators • 3- Unsustainable Impacts of Cars • 4- Sustainable Transportation / Land Use Systems
Unsustainable Transportation B-1 • Resource use • Requires a large array of inputs. • Concrete and steel : infrastructures. • Plastics and metals : vehicles. • Fossil fuels. • Depends on gasoline. • About 35-50 years left of resources at the current consumption rate. • Pollution • High level of concentration. • De-stabilization of ecosystems. • Different scales of effects: from local to global.
Unsustainable Transportation B-1 • Other unsustainable effects • CFCs (air cooling systems). • Noise. • Land consumption (sprawl). • Congestion. • Accidents.
General Indicators B-2 • Nature • Reflecting the sustainability of cities. • A plethora of indicators can be used – 150 indicators were suggested by the World Bank. • Not necessarily linked to the process leading to improvement. • Strategic indicators involve VMT (vehicle-mile traveled), transit ridership and average commuting distance to the workplace. • All studies agree that the automobile dependence is the key to an unsustainable urban environment.
General Indicators Urban Sustainability B-2 Water, materials and waste Energy and air quality Transportation Land, green spaces and biodiversity Livability
General Indicators B-2 • Energy and air quality • Reduce total energy use per capita. • Reduce total quantity of air pollutants per capita. • Reduce total greenhouse gases. • Water, materials and waste • Reduce total water use per capita. • Increase proportion of sewage treated. • Decrease amount of sewage discharged in streams or ocean. • Reduce consumption of building materials per capita. • Reduce consumption of paper and packaging per capita. • Decrease amounts of solid waste. • Increase amounts of organic waste returned to soil and food production.
General Indicators B-2 • Land, green spaces and biodiversity • Preserve agricultural land and natural landscape at the urban fringe. • Increase amount of green space per capita. • Increase density of population and employment in transit serviced areas. • Decrease impact on regional ecosystems. • Livability • Improve overall health figures. • Increase level of education. • Increase leisure opportunities. • Increase safety. • Increase pedestrian streets.
General Indicators B-2 • Transportation • Reduce the amount of Vehicle-Kilometer-Traveled. • Increase transit and decrease car use. • Reduce the average commute distance. • Increase average speed of transit, especially relative to cars. • Increase transit service relative to road service. • Decrease parking space per capita. • Increase kilometers of separated cycleways.
Unsustainable Impacts of Cars B-3 • Economic efficiency • Infrastructure costs. • Expensive infrastructures in suburban areas. • Underutilized infrastructures in central areas. • Transportation costs. • Society assumes several costs. • Fighting car congestion does not solve the problem. • Average commuting is always around 30 minutes. • Land waste. • Loss of land to parking and roads. • Environmental responsibility • Oil vulnerability. • Greenhouse gases.
Unsustainable Impacts of Cars B-3 • Smog. • Sprawl impacts. • Land waste. • Traffic impacts. • Noise. • Accidents. • Social equity • Ownership inequalities. • Location inequalities. • Human livability • Loss of community. • Loss of public safety.
Sustainable Transportation B-4 Sustainable Development Sustainable Transportation Modes Infrastructures Logistics Environment Climate Change Air quality Noise Land Use Waste Economy Growth Jobs and Prosperity Fair Pricing Competitiveness Choice Society Safety Health Disturbance Access Equity