Download
1 / 42
440 likes | 725 Views
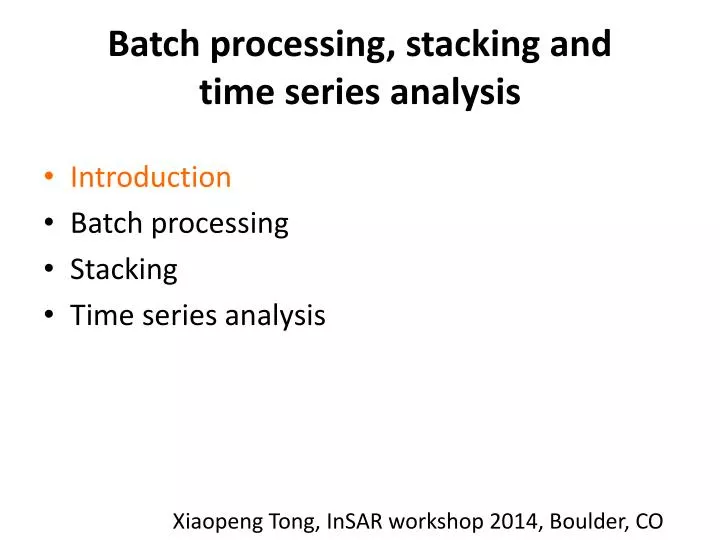
Batch processing, stacking and time series analysis. Introduction Batch processing Stacking Time series analysis. Xiaopeng Tong, InSAR workshop 2014, Boulder, CO. Image alignment. Azimuth. Range. Image alignment. Range. reference. repeat. Azimuth. Aligned SAR data stacks.

E N D
Batch processing, stacking and time series analysis • Introduction • Batch processing • Stacking • Time series analysis Xiaopeng Tong, InSARworkshop 2014, Boulder, CO
Image alignment Azimuth Range
Image alignment Range reference repeat Azimuth
Introduction • Batching processing: Automatic processing of a stack of SAR data to generate interferograms • Stacking: Average multiple interferograms to estimate velocity and standard deviations • Time-series analysis methods: SBAS, PSInSAR • Written in shell and is easy to modify so advanced users are welcome to develop new scripts
combined high-resolution velocity ftp://topex.ucsd.edu/pub/SAF_models/insar/ALOS_ASC_masked.kmz standard deviation [Tong et al., 2013]
Parkfield SAF red 10 mm/yr blue -10mm/yr
Parkfield SAF red 10 mm/yr blue -10mm/yr
Batch processing, stacking and time series analysis • Introduction • Batch processing • Stacking • Time series analysis InSAR workshop 2014, Boulder, CO
Overview • Batch processing: • Preprocessing without a master image pre_proc_init.csh • Preprocessing with a master image pre_proc_batch.csh • Align a stack of SAR data align_batch.csh • Form a stack of interferogramsintf_batch.csh
Batch processing: pre_proc_init.csh • Function: • preprocess a stack of SAR data using default parameters (earth radius, Doppler centroid, near range) • Generate baseline-time plot to choose master images, alignment strategy, interferometric pairs
Baseline-time plot: stacktable_all.ps Super master
Batch processing: pre_proc_batch.csh • Function: • preprocess a stack of SAR data using uniform parameters (earth radius, Doppler centroid, near range) to make them geometrically consistent with one single image (super master)
Batch processing: pre_proc_batch.csh 1. Modify data.in file Super master 2. Delete old PRM and raw files
Batch processing: pre_proc_batch.csh 3. Modify batch.config file and run pre_proc_batch.csh Stop here to look at the batch.config file
Batch processing: align_batch.csh • Function: • Focus SAR images to form Single Look Complex (SLC) data • Align (image registration) a stack of SLC data using 2D cross-correlation within sub-pixel (<10m) accuracy
Baseline time plot Super master
“Leap frog” method to align SAR images slave master
“Leap frog” method to align SAR images Surrogate master Slave
Batch processing: align_batch.csh 1. Edit align.in file Super master Master or Surrogate master Slave 2. Then run align_batch.csh Time-consuming part of the processing .. take a break here ..
Batch processing: intf_batch.csh • Function: • Convert Digital Elevation Model into radar coordinates • Form interferograms using two SLC data • Remove phase due to earth curvature and topography • Plot amplitude, correlation, phase using GMT • Unwrap using SNAPHU • Geocode and make Google Earth KML files
Batch processing: intf_batch.csh 1. Edit intf.in file to choose inteferogram pairs
Batch processing: intf_batch.csh 2. Make dem.grd file and put it inside topo/ directory
Batch processing: intf_batch.csh 3. Check/modify batch.config file Time-consuming part of the processing .. take a break here ..
Batch processing: results • All interferograms are in different folders in intf/ • The folder can be named after either date or orbital number • Modify batch.config to choose among date or orbital number • Each interferogram folder contains the following files: • Amplitude, phase, correlation, unwrapped phase, filtered phase image files in GMT/NetCDF format “.grd” • Corresponding files after geocoding with subfix “_ll.grd” • Postscripts plots: “.ps” • Google Earth “.kml” and “.png”
Batch processing: results Phase of the 3 interferograms
Batch processing, stacking and time series analysis • Introduction • Batch processing • Stacking • Time series analysis (SBAS) InSAR workshop 2014, Boulder, CO
Stacking: stack_phase.bash • Function: • Average unwrapped phase • Convert the phase (radius) to velocity (mm/yr) • Note: it’s necessary to check the unwrapped phase before stacking or time-series analysis because unwrapping from SNAPHU may give errors, which will corrupt results • More complex processing techniques (e.g. filtering, detrending, GPS/InSAR integration) is incorporated along with stacking
Math of stacking (Appendix C) Unwrapped phase Time span Recovered deformation True deformation atmosphere topography
Stacking example with the complete data set Track 213 Frame 660 Land subsidence near Coachella Valley, California
Batch processing, stacking and time series analysis • Introduction • Batch processing • Stacking • Time series analysis (SBAS) InSAR workshop 2014, Boulder, CO
T213 F660 ALOS SBAS 88 interferograms 28 scenes 20 km filter Since 2006/01/01
Point B Time-series show seasonal variation and linear trend Point A
Summary • Batch processing shell scripts provide automatic InSAR data processing • Stacking scripts provide methods to estimate mean velocity and its standard deviations. • Advanced user can develop custom scripts using tools inside GMT and GMTSAR. • InSAR time-series analysis tool has been developed and will be in the next version of GMTSAR. • Any questions?