Download
1 / 9
90 likes | 209 Views
MAP and Paws data report for 2010-11. Park County School District #6. Measures of Academic Performance MAP. Purpose: Progress Monitor tool for K-3 Reading (Individual Reading Plan-IRP) State Pilot Mandate – Fall 2011 through Spring 2012. Use of MAP Data:

E N D
MAP and Paws data report for 2010-11 Park County School District #6
Measures of Academic PerformanceMAP • Purpose: • Progress Monitor tool for K-3 Reading (Individual Reading Plan-IRP) • State Pilot Mandate – Fall 2011 through Spring 2012 • Use of MAP Data: • One leg of data used in Title I-A Schools • One leg of data used to identify students for Response to Intervention support • Placement of incoming students i.e. home school/private school • Pre (Fall) and Post (Spring) Data to show growth; • Feedback is timely • Determine areas of strength and areas in need of improvement • RIT Bands • Des Cartes Strategies • Validated data for Teacher/Principal Evaluation
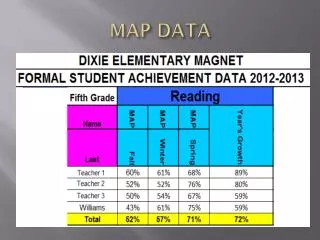
Additional MAP Data Clarification • The MAP data in this report is specific to student growth using the mean score. • Even though this report and the WDE 626 both use MAP as their data source, • the scores look different due to: • WDE 626 uses a state established cut score for proficiency • NWEA MAP uses a mean score to report student growth • Note that there is no MAP growth targets for mathematics on the report for • Grades 9-12 – this is due being grade specific i.e. 9th graders may be in • algebra I or geometry or algebra II or applied math.
State Assessment - PAWS Data • Purpose: • Establish Adequate Yearly Progress (AYP) • Meet requirements of No Child Left Behind (NCLB) • Use of PAWS Data: • One leg of data used in Title I-A Schools • One leg of data used to identify students for Response to Intervention support • Shows trends for sub-groups; • Graduation Rate • Gender • Socio-Economic Status (SES) • Special Education • May be used to set school/department goals • Validated data for Teacher/Principal Evaluation
2011-2012 Map/paws plan • MAP • K-12 • Fall • Winter • Spring • PAWS • SPRING 2012 • ADMINISTRATION • GRADES 3-8 & 11*