Download
1 / 1
10 likes | 158 Views
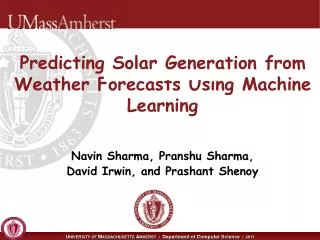
Predicting Solar Generation from Weather Forecasts. Advisor: Professor Arye Nehorai Chenlin Wu, Yuhan Lou Department of Electrical and Systems Engineering. Principal Component Analysis (PCA). Kernel Trick for SVR. Some weather metrics correlate strongly

E N D
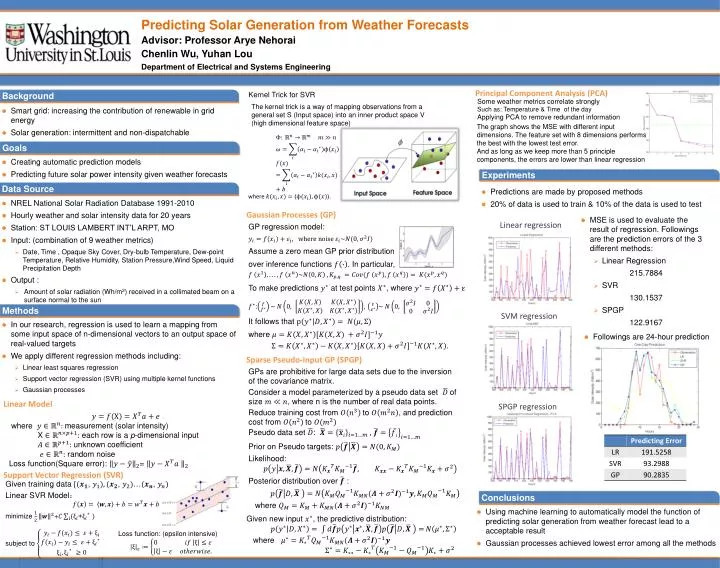
Predicting Solar Generation from Weather Forecasts Advisor: Professor AryeNehorai Chenlin Wu, Yuhan Lou Department of Electrical and Systems Engineering Principal Component Analysis (PCA) Kernel Trick for SVR • Some weather metrics correlate strongly Such as: Temperature & Time of the day • Applying PCA to remove redundant information Methods Conclusions Background Data Source Experiments Goals The kernel trick is a way of mapping observations from a general set S (Input space) into an inner product space V (high dimensional feature space) • Smart grid: increasing the contribution of renewable in grid energy • Solar generation: intermittent and non-dispatchable The graph shows the MSE with different input dimensions. The feature set with 8 dimensions performs the best with the lowest test error. And as long as we keep more than 5 principle components, the errors are lower than linear regression • where. • Creating automatic prediction models • Predicting future solar power intensity given weather forecasts • Predictions are made by proposed methods • 20% of data is used to train & 10% of the data is used to test • NREL National Solar Radiation Database 1991-2010 • Hourly weather and solar intensity data for 20 years • Station: ST LOUIS LAMBERT INT’L ARPT, MO • Input: (combination of 9 weather metrics) • Date, Time , Opaque Sky Cover, Dry-bulb Temperature, Dew-point Temperature, Relative Humidity, Station Pressure,Wind Speed, Liquid Precipitation Depth • Output : • Amount of solar radiation (Wh/m2) received in a collimated beam on a surface normal to the sun Gaussian Processes (GP) • MSE is used to evaluate the result of regression. Followings are the prediction errorsof the 3 different methods: • Linear Regression • 215.7884 • SVR • 130.1537 • SPGP • 122.9167 Linear regression GP regression model: Assume a zero mean GP prior distribution over inference functions . In particular, To make predictions at test points , where :, It follows that where SVM regression • In our research, regression is used to learn a mapping from some input space of n-dimensional vectors to an output space of real-valued targets • We apply different regression methods including: • Linear least squares regression • Support vector regression (SVR) using multiple kernel functions • Gaussian processes • Followings are 24-hour prediction Sparse Pseudo-input GP (SPGP) GPs are prohibitive for large data sets due to the inversion of the covariance matrix. Consider a model parameterized by a pseudo data set of size , where n is the number of real data points. Reduce training cost from to , and prediction cost from to Linear Model SPGP regression where measurement (solar intensity) X each row is a p-dimensional input unknown coefficient random noise Loss function(Square error): = Pseudo data set : Prior on Pseudo targets: Likelihood: Posterior distribution over : where Support Vector Regression (SVR) Given training data,…, Linear SVR Model: minimize + subject to • Using machine learning to automatically model the function of predicting solar generation from weather forecast lead to a acceptable result • Gaussian processes achieved lowest error among all the methods Given new input , the predictive distribution: where Loss function: (epsilon intensive)