Download
1 / 1
10 likes | 169 Views
A Color Shifting Equilibrium of Cobalt. I - < Br - < Cl - < F - < OH - < H 2 O < NH 3 < en < NO 2 < CN - < CO Smaller Larger Splitting Splitting

E N D
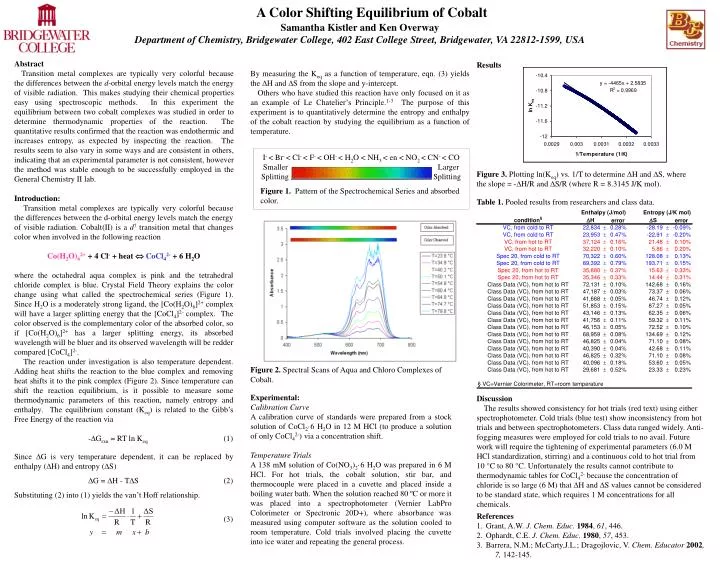
A Color Shifting Equilibrium of Cobalt I- < Br- < Cl- < F- < OH- < H2O < NH3 < en < NO2 < CN- < CO Smaller Larger Splitting Splitting Figure 1. Pattern of the Spectrochemical Series and absorbed color. Samantha Kistler and Ken Overway Department of Chemistry, Bridgewater College, 402 East College Street, Bridgewater, VA 22812-1599, USA Abstract Transition metal complexes are typically very colorful because the differences between the d-orbital energy levels match the energy of visible radiation. This makes studying their chemical properties easy using spectroscopic methods. In this experiment the equilibrium between two cobalt complexes was studied in order to determine thermodynamic properties of the reaction. The quantitative results confirmed that the reaction was endothermic and increases entropy, as expected by inspecting the reaction. The results seem to also vary in some ways and are consistent in others, indicating that an experimental parameter is not consistent, however the method was stable enough to be successfully employed in the General Chemistry II lab. Results By measuring the Keq as a function of temperature, eqn. (3) yields the H and S from the slope and y-intercept. Others who have studied this reaction have only focused on it as an example of Le Chatelier’s Principle.1-3 The purpose of this experiment is to quantitatively determine the entropy and enthalpy of the cobalt reaction by studying the equilibrium as a function of temperature. Figure 3. Plotting ln(Keq) vs. 1/T to determine DH and DS, where the slope = -DH/R and DS/R (where R = 8.3145 J/K mol). Introduction: Transition metal complexes are typically very colorful because the differences between the d-orbital energy levels match the energy of visible radiation. Cobalt(II) is a d7 transition metal that changes color when involved in the following reaction Co(H2O)62+ + 4 Cl- + heat CoCl42- + 6 H2O where the octahedral aqua complex is pink and the tetrahedral chloride complex is blue. Crystal Field Theory explains the color change using what called the spectrochemical series (Figure 1). Since H2O is a moderately strong ligand, the [Co(H2O)6]2+ complex will have a larger splitting energy that the [CoCl4]2- complex. The color observed is the complementary color of the absorbed color, so if [Co(H2O)6]2+ has a larger splitting energy, its absorbed wavelength will be bluer and its observed wavelength will be redder compared [CoCl4]2-. The reaction under investigation is also temperature dependent. Adding heat shifts the reaction to the blue complex and removing heat shifts it to the pink complex (Figure 2). Since temperature can shift the reaction equilibrium, is it possible to measure some thermodynamic parameters of this reaction, namely entropy and enthalpy. The equilibrium constant (Keq) is related to the Gibb’s Free Energy of the reaction via -Grxn = RT ln Keq (1) Table 1. Pooled results from researchers and class data. Figure 2. Spectral Scans of Aqua and Chloro Complexes of Cobalt. Experimental: Calibration Curve A calibration curve of standards were prepared from a stock solution of CoCl2·6 H2O in 12 M HCl (to produce a solution of only CoCl42-) via a concentration shift. Temperature Trials A 138 mM solution of Co(NO3)2·6 H2O was prepared in 6 M HCl. For hot trials, the cobalt solution, stir bar, and thermocouple were placed in a cuvette and placed inside a boiling water bath. When the solution reached 80 ºC or more it was placed into a spectrophotometer (Vernier LabPro Colorimeter or Spectronic 20D+), where absorbance was measured using computer software as the solution cooled to room temperature. Cold trials involved placing the cuvette into ice water and repeating the general process. Discussion The results showed consistency for hot trials (red text) using either spectrophotometer. Cold trials (blue test) show inconsistency from hot trials and between spectrophotometers. Class data ranged widely. Anti-fogging measures were employed for cold trials to no avail. Future work will require the tightening of experimental parameters (6.0 M HCl standardization, stirring) and a continuous cold to hot trial from 10 °C to 80 °C. Unfortunately the results cannot contribute to thermodynamic tables for CoCl42- because the concentration of chloride is so large (6 M) that DH and DS values cannot be considered to be standard state, which requires 1 M concentrations for all chemicals. Since G is very temperature dependent, it can be replaced by enthalpy (H) and entropy (S) G = H - TS (2) Substituting (2) into (1) yields the van’t Hoff relationship. (3) References 1. Grant, A.W. J. Chem. Educ.1984, 61, 446. 2. Ophardt, C.E. J. Chem. Educ.1980, 57, 453. 3. Barrera, N.M.; McCarty,J.L.; Dragojlovic, V. Chem. Educator 2002, 7, 142-145.