Download
1 / 12
150 likes | 362 Views
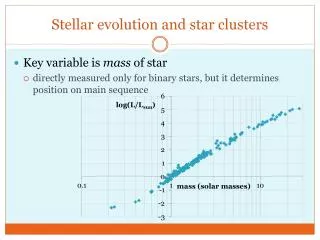
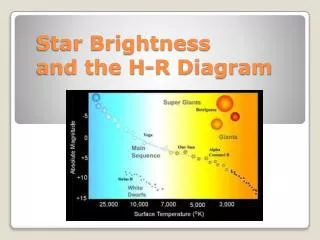
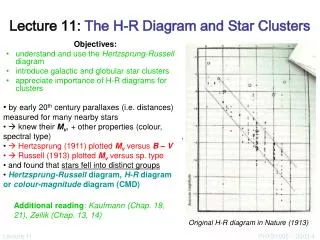
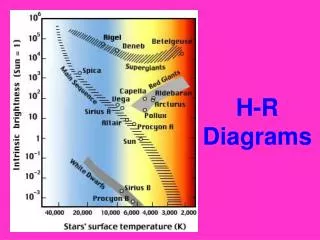
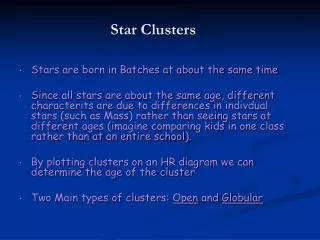
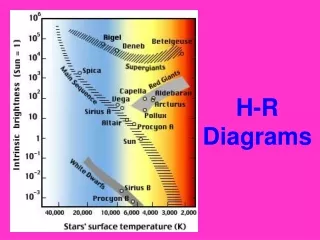
H-R diagrams for star clusters. H-R Diagram. Relation between luminosity L , temperature T and radius R : L = 4 R 2 T 4. H-R diagram for closest stars. Stellar evolution on H-R diagram. Theoretical isochrones. Observational diagrams H-R.

E N D
Relation between luminosity L, temperature T and radius R:L = 4R2T4
Observational diagrams H-R Instead of luminosity L – observed flux in V filter: V = -2.5log10(FV/FV0) Instead of temperature – difference of fluxes in filters BandV: B-V whereB = -2.5log10(FB/FB0)
Problems • Calibration Standard stars with known values of Vsi Bs should be observed; values of reference fluxes FV0 i FB0 can be calculated from the formula: Vs= -2.5log10(Fs/FV0) Information about standard stars can be found at: http://cadcwww.hia.nrc.ca/cadcbin/wdb/astrocat/stetson/query • Interstellar extinction (reddening) Hint: observe clusters with b < –10orb > +10 • Stars in clusters may vary in brightness by a few orders of magnitude One should make observations of different length or – better – make several observations and combine the data
Strategy • Choose suitable clusters Information about open clusters can be found at: http://www.seds.org/~spider/ngc/ngc.html http://www.univie.ac.at/webda//navigation.html • Choose suitable field with standard stars • Observe standard stars and the cluster • Using SalsaJ software make photometric measurements of stars • Export results to Excel and create H-R diagram