Download
1 / 1
20 likes | 132 Views
Effects of Drought on Water Quality in Streams Rashad Riley 1 , Xiangning Huang 2 , Jaewoo Lee 3 , Ganeshchandra Mallya 2 , K.V. Nedunuri 1 , Lan Zhao 3 , Indrajeet Chaubey 4

E N D
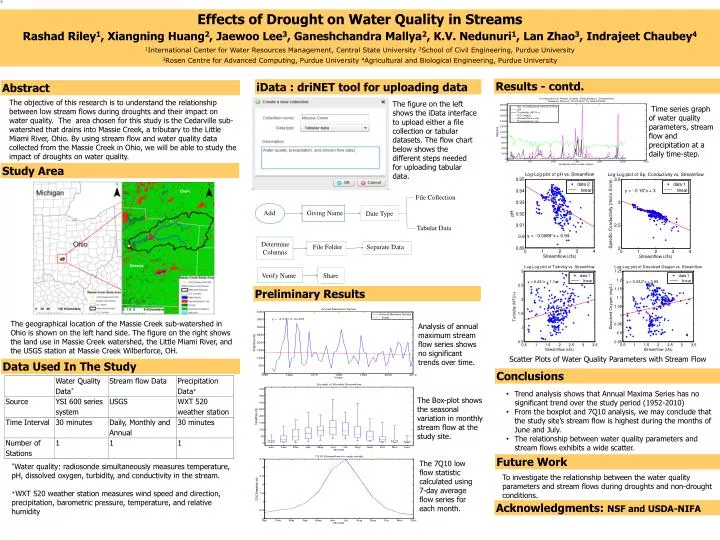
Effects of Drought on Water Quality in Streams Rashad Riley1, Xiangning Huang2, Jaewoo Lee3, Ganeshchandra Mallya2, K.V. Nedunuri1, Lan Zhao3, Indrajeet Chaubey4 1International Center for Water Resources Management, Central State University 2School of Civil Engineering, Purdue University 3Rosen Centre for Advanced Computing, Purdue University 4Agricultural and Biological Engineering, Purdue University Results - contd. iData : driNET tool for uploading data Abstract The objective of this research is to understand the relationship between low stream flows during droughts and their impact on water quality. The area chosen for this study is the Cedarville sub-watershedthatdrains into Massie Creek, a tributary to the Little Miami River, Ohio. By using stream flow and water quality data collected from the Massie Creek in Ohio, we will be able to study the impact of droughts on water quality. • The figure on the left shows the iData interface to upload either a file collection or tabular datasets. The flow chart below shows the different steps needed for uploading tabular data. Time series graph of water quality parameters, stream flow and precipitation at a daily time-step. Study Area File Collection Add Giving Name Date Type Tabular Data Determine Columns File Folder Separate Data Verify Name Share Preliminary Results The geographical location of the Massie Creek sub-watershed in Ohio is shown on the left hand side. The figure on the right shows the land use in Massie Creek watershed, the Little Miami River, and the USGS station at Massie Creek Wilberforce, OH. Analysis of annual maximum stream flow series shows no significant trends over time. Scatter Plotsof Water Quality Parameters with Stream Flow Data Used In The Study Conclusions • Trend analysis shows that Annual Maxima Series has no significant trend over the study period (1952-2010) • From the boxplot and 7Q10 analysis, we mayconclude that the study site’s stream flow is highest during the months of June and July. • The relationship between water quality parameters and stream flows exhibits a wide scatter. The Box-plot shows the seasonal variation in monthly stream flow at the study site. Future Work The 7Q10 low flow statistic calculated using 7-day average flow series for each month. *Water quality: radiosonde simultaneously measures temperature, pH, dissolved oxygen, turbidity, and conductivity in the stream. +WXT 520 weather station measures wind speed and direction, precipitation, barometric pressure, temperature, and relative humidity To investigate the relationship between the water quality parameters and stream flows during droughts and non-drought conditions. Acknowledgments: NSF and USDA-NIFA