Download
1 / 77
790 likes | 958 Views
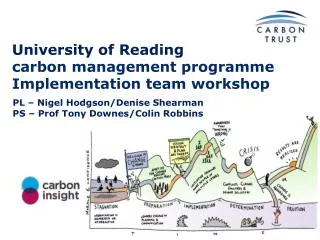
University of Reading Carbon management programme Opps and Quantification workshop. Project Leads: Nigel Hodgson & Denise Shearman Project Sponsors: Prof Tony Downes & Colin Robbins. Objectives of today. Identify and prioritise carbon saving opportunities for your HEI

E N D
University of ReadingCarbon management programme Opps and Quantification workshop Project Leads: Nigel Hodgson & Denise ShearmanProject Sponsors: Prof Tony Downes & Colin Robbins
Objectives of today • Identify and prioritise carbon saving opportunities for your HEI • Understand and practise the quantification process • Engage and mobilise the wider team on carbon management
Workshop agenda • Introductions/background • Where are we now • Baseline • Target • What we can do about it • RAP tool and DECs • Brainstorming & prioritisation • The project process • Quantification • Next steps
What is Carbon Management? • Comprehensive action plan • Good practice • Walking the talk • Taking responsibility • Makes financial sense • Involves everyone The What and the How • Organisational • Policy & decision making • Cultural • Communications • Permission to question • Technical • Information • Discipline • Projects • Continuous improvement
HECM6 – the timeline We are here
Emissions baseline scope Transport Buildings Other Electricity Fleet Waste Fossil fuels Business miles BASELINE SCOPE Water Commuting Refrigerant gases ?
Ideas generation - Sources Carbon Reduction Suggestions DECs & RAP Tool Brainstorming We Need Your Ideas Now Baseline Analysis Suggestion Schemes Project List (Kept in the CMPR) Existing Projects Site Surveys
Current projects • Make a list of current projects • CHP energy centre • Wind farm • Pipework and valve insulation • Heating controls • Lighting control - solar • Projects identified from previous Carbon Trust surveys • Heating zoning • Energy awareness • High frequency lighting • LED lighting • Passive infra red lighting control • Automatic computer shutdown
Exercise – Other projects • What other projects are happening at the University that may reduce or increase carbon emissions • In groups discuss for 5-10 minutes and then feedback
Ideas generation - Sources Carbon Reduction Suggestions DECs & RAP Tool Brainstorming We Need Your Ideas Now Baseline Analysis Suggestion Schemes Project List (Kept in the CMPR) Existing Projects Site Surveys
Getting the best out of DECs • DECs are not EPCs • Measure of how effectively the building is used • Create multiple league tables by building type that focus surveys and investment • Use within awareness campaigns • Baseline tool helps to rank and prioritise
Where is the University? • 49 buildings currently fall within EPBD • Average DEC score – 116
Ideas generation - Sources Carbon Reduction Suggestions DECs & RAP Tool Brainstorming We Need Your Ideas Now Baseline Analysis Suggestion Schemes Project List (Kept in the CMPR) Existing Projects Site Surveys
How can the targets be met? Needs high commitment and commercial /risk management skills ??% Design & Asset Management Low CO2 new build Property rationalisation Procurement changes Longer term, larger scale 10% Invest to Save Insulation and heat recovery Lighting and controls Combined heat and power (CHP) Plant / fleet replacement Mature technologies, medium investment 20% Good Housekeeping Metering and Targeting Behaviour change and training Regular inspection & Audit Low cost but requires human resources 10% 60% Organisational realignment Policy change, process review Renewable Technologies Biomass boilers, Wind Solar thermal, GSHP 50% 40% 30% 20% 10%
Inspirational organisations & projects Fuel cell CHP - Woking Low Carbon vehicle for VC - Southampton University Lighting controls – University of Edinburgh Server virtualisation – Sheffield Hallam University Fenestration (reducing air leaks) – Derby University
Inspirational organisations & projects (Continued) Dial4Light scheme - Germany • University of Hertfordshire • Full time travel plan co-ordinator • Limited parking permits • Free park and ride facility • University owned bus service • Car sharing database • Subsidised local travel for students • Cycling facilities • Walking promotion • Information 1.5MW wind turbine - Swaffham Energy awareness campaign – University of Glasgow
Inspirational organisations & projects • Stockton-on-Tees • In-house driver training programme for fuel efficiency • Revenue gained from training of external organisations • 10-15% reduction in fuel use for every person trained • Central Bedfordshire • LED replacement for traditional lanterns at end-of-life • Pilot saw ~ 75% reduction in circuit wattage • ¼ year payback for uplift in capital cost
Individual Vision • What would your place of work be like if you had the power to make it any way you wanted? • Where would you work? • How would people get to their workplaces? • What would the buildings be like? • How would you meet with people? • What are other people doing? • How would teaching/research fit in? • What kind of energy would be used for heating? • For transportation? For travel? Where would it come from? • How would the air, water, and environment be kept clean?
Our Vision • Our target for 2015/16 is 35% reduction on 2008/09 baseline • What items on the individual visions can we all get behind? • Are there any conflicts? What are the larger hurdles likely to be? • Our current stated vision … • What does this mean? A vision without a plan is just a dream. A plan without a vision is just drudgery. But a vision with a plan can change the world
How to get the most out of the session Participation – feel free to speak up Ideas - build on others’ ideas Sharing experiences Reserve judgement NO qualifications Forbidden phrases Brainstorming rules “that won’t work because…..” “we can’t do that because…..” “that would never be approved…..”
Brainstorming streams • IT and Systems • Water and Energy • Transport • Waste • Other
In your groups, brainstorm any ideas that occur to you across the areas of the scope: Bear in mind the Organisation’s other relevant strategies Focus on large baseline factors Buildings, transport, water, procurement, HR, organisational practices, day-day management, etc Opportunities Raise ideas that you have brought with you What you can do What would you like to see happen? Looking for quantity at this stage not quality Ideas Generation - Brainstorming
Prioritisation Have generated a long list of ideas • Short term • Longer term • Easy wins • Inspirational • Integration • Etc Need to produce a quantified shortlist and begin to prioritise • Starting right now…
1 2 3 4 5 6 7 8 9 Ease & Effect rules • Ease factors to consider: • Cost (capital and revenue) • Cost (staff time) • Staff support • Technical practicality • Effect factors: • Carbon savings • Galvanising/engaging staff support • Public awareness
1 2 3 4 5 6 7 8 9 Prioritisation – Ease & Effect Matrix EASE OF IMPLEMENTATION Easy Moderate Difficult V. Effective EFFECT ON EMISSIONS Moderate Ineffective
Focusing Effort • Important to focus effort to gain best effect • Do you know how your organisation’s consumption pattern compares to the sector average? • Are there large ‘special’ loads? 2006 HE Sector Carbon Emissions (Hefce Jan 2010)
Space Heating Opportunities • Improve Building Fabric • Install/ Upgrade Insulation • Double / Secondary Glazing • Draft-Proofing • Install / Optimise Control Systems • Optimum Start • Sequencing • Zoning • Pipe Insulation • Boiler Upgrades • Boiler Fuel Switching Breakdown of Energy Use (kWh) in HE buildings (CTV020)
Lighting Opportunities • Retrofit / Replace Fittings • Control Systems • Presence detection (microwave or infrared) • Lux level switching • Localised well labelled controls where automation infeasible • Zoning • Remember to look inside and outside! Breakdown of Energy Use (kWh) in HE buildings (CTV020)
ICT Opportunities A large area where energy use is expanding • Management Software • Auto shutdown software for non-critical machines • Flat Panel Monitors • 60% savings! • Printer Rationalisation • Centralise • Server Room / Data Centres • Virtualisation • Heat Recovery & Cooling Breakdown of Energy Use (kWh) in HE buildings (CTV020) What will your IT infrastructure look like in 10 years?
Travel Opportunities • What are you including in scope? • Travel Planning • Fleet Driver Training (Safed) • Travel Surveys • Incentive Schemes • Bike to Work • Car Sharing 2006 HE Sector Carbon Emissions (Hefce Jan 2010)
Other Opportunities • Awareness Raising • Potential Savings of 5-10% (CTG001) • Monitoring & Targeting • Potential Savings of 5-12% (CTV027) • Good Practice Maintenance 2006 HE Sector Carbon Emissions (Hefce Jan 2010) What activities have you already undertaken?
What is the RAP Tool • Rapid Assessment of Potential • Considers key opportunities around buildings and transportation • Packed with data on how to quantify different types of opportunity • Key team members have their own assessment sheet • Individual copies returned to PL for collation into tool
RAP Tool Process • Project Leader will distribute the tool containing baseline data • For buildings and transport tabs team members complete: • Score each opportunity against applicability and likelihood – Document any assumptions you make • Identify how easy this project will be (1=Easy / 3 = Hard) • Identify who will take responsibility for the project • Should take approximately of 1-2hours to complete • Return to the Project Leader to collate into the master
Following The RAP Tool • Project Leader will use master RAP Tool to identify which projects will be further quantified based on ease and effect • Project Team members will refine areas identified in the RAP Tool into distinct quantified projects • Quantified Projects will be recorded in the CMPR Tool by PL (to be released in September)
Pushing projects down the funnel confidence range £ Cost of tonnes of CO2 saved Using rules of thumb & guidance Off the head estimate Contracted price First ideas Brainstorm SWAG CMP content Detailed Planning Implementation
The ‘project’ process Ease-Effect Research Project ideas CMT input DECs 1 hr 1 day 1 min Target (xx%) Existing projects RAP GAP RAP Brainstorm Prioritisation Quantification Existing projects Long list Short list CMPR Output
The ‘project’ process Ease-Effect Research Project ideas CMT input DECs 1 hr 1 day 1 min Target (xx%) Existing projects RAP Improve RAP estimates GAP RAP Brainstorm Prioritisation Quantification Existing projects Long list Short list CMPR Output
The project process • Initial Prioritisation • Typically should take 1 min per opportunity • RAP combined with Ease and Effect • Project Register Content • 1-2 hour per opportunity • RAP tool refinement • Grouping into larger projects • What questions do you need answering • What assumptions can be made • Using rules of thumb-guides • Approval: including cost • At least 1 day per opportunity
Minimum for CMP • Initial Prioritisation • Typically should take 1 min per opportunity • RAP combined with Ease and Effect • Project Register Content • 1-2 hour per opportunity • RAP tool refinement • Grouping into larger projects • What questions do you need answering • What assumptions can be made • Using rules of thumb-guides • Approval: including cost • At least 1 day per opportunity