Download

1 / 29
290 likes | 408 Views
Memory Access Behavior Analysis with CPTE - Counter-based Profiling and Tracing Environment. Michael Gerndt, Tianchao Li Technische Universität München {gerndt, lit}@in.tum.de. Performance Analysis for Parallel Systems. Development cycle Assumption: Reproducibility Monitoring

E N D
Memory Access Behavior Analysis with CPTE- Counter-based Profiling and Tracing Environment Michael Gerndt, Tianchao Li Technische Universität München {gerndt, lit}@in.tum.de
Performance Analysis for Parallel Systems • Development cycle • Assumption: Reproducibility • Monitoring • Software vs Hardware • Statistical profiles vs Event traces • Analysis • Source-based tools • Visualization tools • Automatic analysis tools Coding Performance Monitoringand Analysis Program Tuning Production
Performance Measurement Techniques • Event model of the execution • Events occur at a processor at a specific point in time • Events belong to event types • clock cycles • cache misses • remote references • start of a send operation • ... • Profiling: Recording accumulated performance data for events • Tracing: Recording performance data of individual events
Tr P n-1 Trace P1 Trace P0 Tracing ... Function Obelix (...) call monitor(“Obelix“, “enter“) ... call MPI_send(…) call monitor(“Obelix“,“exit“)end Obelix ... Process 0 Process 1 MPI Library Function MPI_send (...) call monitor(“MPI_send“, “enter“) ... call monitor(“MPI_send“,“exit“)end Obelix ... Process n-1
10 200 Instrumentation and Monitoring CPU ... Function Obelix (...) call monitor(“Obelix“, “enter“) ... call monitor(“Obelix“,“exit“)end Obelix ... cache miss counter monitor(routine, location) if (“enter“) then else end if Function Table Main Asterix + - Obelix 10 1490 1300
CPTE • Counter-based Profiling and Tracing Environment • Selective Instrumentation • Selective Monitoring • Profiling, Tracing and Sampling
Fortran 95 Selective Instrumentation • Based on NAG Fortran 95 frontend • the only Fortran 95 instrumenter based on a productive quality front-end? • Instruments Fortran 95 programs • Inserts calls to monitoring library • Allows to select regions to be instrumented • FileID-FirstLine# as region ID • Generates information about instrumented regions • Selective Instrumentation • Reduce the measurement perturbation of the program
Instumentable Regions • Command line arguments allow to control instrumentation of sequential and OpenMP parallel regions • Main program, subprograms • Outermost and nested multidimensional loops • Vector statements, Where-, Forall-statements • Subroutine calls • I/O statements • OpenMP parallel regions • OpenMP synchronization • Handles arbitrary control flow • Generates Standard Intermediate Representation (SIR)
Example of Nested Loops Instrumentation call enter_region(LOOP,17,42) do i=1,n //orig line 42 do j=1,n a(i,j)=... call enter_region(LOOP,17,45) do k=1,n //orig line 45 ... enddo call end_region(LOOP,17,45) enddo enddo call end_region(LOOP,17,42)
Example of Instrumentation Transformations call start_region(LOOP,42,17) do i=1,n ... call start_region(LOOP,42,19) do j=1,m ... call end_region(LOOP,42,17,TRUE) GOTO 123 enddo call end_region(LOOP,42,19,FALSE) enddo call end_region(LOOP,42,17,FALSE) ... 123 continue
Instrumentation of OpenMP program hello integer a(100) !$OMP parallel do do i=1,100 a(i)=i enddo end implicit barrier synchronization
Instrumented OpenMP CALL start_region(PARALLEL,42,17) !$OMP PARALLEL CALL start_region(PARALLELBODY,42,17) CALL start_region(DO,42,17) !$ OMP DO DO i=1,n ... END DO !$OMP END DO NOWAIT CALL start_region(IMPLBARRIER,42,17) !$OMP BARRIER CALL end_region(IMPLBARRIER,42,17) CALL end_region(DO,42,17) CALL end_region(PARALLELBODY,42,17) !$OMP END PARALLEL CALL end_region(PARALLEL,42,17) explicit barrier synchronization
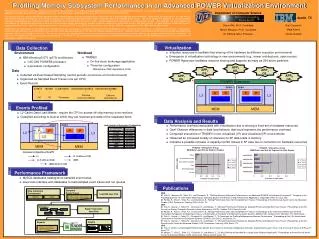
B D A C E 6 5 4 3 2 1 Application Interface Request File Missed Request File Measurement Result Trace Buffer Measurement Stack Counter Layer Counter Library PCL Monitoring Library Application Region Table Wildcard Table
Monitor Library Interface • Start_Region (RType, FileID, RFL) • End_Region (RType, FileID, RFL) • Marks the start/end of a region. • RType is the region type • FileID the unique number assigned to a file • RFL the first line number of the region in the file. • End_All_Regions (FileID, RFL) • Inserted before STOP statements. • Enter_Region (RType, FileID, RFL) • Leave_Region (RType, FileID, RFL) • Marks the start/end of a subprogram that is not instrumented • Ignore_Next_Entry_Point (RType, FileID, RFL) • inserted before ENTRY statements
Request File • Global and region measurement requests • Both for all or some nodes • Global • Different types of monitoring overheads including file flush • Summary at program termination • Region-based measurement requests • Region specification • Region type, file, region first line number • Region type, file, * • Region type, *, * • Information • Execution_time, cache misses, specific instructions
Request File • Measurement Request Language (MRL) //Trace file go to a subdirectory CONFIG TDF_PATH=data; //Request sampling CONFIG REGION_SAMPLING_RATE=100; //Request additional summary information CONFIG REGION_SUMMARY=ON; //Request L2 cache misses for all loops in all processes REQUEST (*) LOCAL (*,LOOP,*)=L2_CACHE_MISS; //Request overhead information REQUEST (*) GLOBAL GLOBAL_OVERHEAD;
B D A C E 6 5 4 3 2 1 Application Interface Request File Missed Request File Measurement Result Trace Buffer Measurement Stack Counter Layer Counter Library PCL Monitoring Library Application Region Table Wildcard Table
Performance Cockpit • A common GUI platform for the integration of several performance measurement tools • Based on Eclipse, CDT, (PTP) • www.eclipse.org • The starting point of a Universal GUI Platform for Performance Tools • programming language neutral • programming paradigm neutral • performance tool neutral
CPTE Plug-in EPCM Plug-in Instrumentation Plug-ins Example Plug-ins Performance Platform Eclipse + CDT + Fortran Plug-in The General Extensible Infrastructure
EPCM • Based on simulator for shared memory multi-processor • Following a novel hardware monitor design • Runtime instrumentation of application binary, on-the-fly simulation of cache access behavior and performance monitoring • Static mode • Address-range specific measurement per counter • Dynamic mode • Histogram for address range with all counters
Performance Cockpit http://wwwbode.in.tum.de/~lit/cockpit/
Summary • CPTE – Counter-based Profiling and Tracing Environment • Selective instrumentation for OpenMP Fortran 95 source codes • Selective monitoring on specified code regions (through MRL) • Performance Cockpit - general extensible GUI for performance tools integration based on Eclipse