Download
1 / 38
380 likes | 384 Views
This report presents the findings from the University of North Alabama's alumni marketing survey, providing invaluable data on alumni satisfaction and expectations. Discover the key areas where UNA is meeting or falling short of expectations, allowing for strategic improvements to better serve alumni and enhance their connection to the university.

E N D
University Of North AlabamaAlumni Marketing Survey Results Dr. Andrew L. Luna Director Institutional Research, Planning and Assessment
Alumni Marketing Survey ResultsMarketing Surveys and UWG • As part of a comprehensive marketing plan, UNA administered surveys to key target audiences • Alumni • Current Freshmen • Prospective Students • Results from this year’s survey would serve as a baseline for subsequent surveys • The surveys will be re-administered in Fall 2010
Alumni Marketing Survey ResultsUniversity Involvement • University Advancement • University Relations • Web Master • Marketing Committee • Institutional Research, Planning, and Assessment
Alumni Marketing Survey ResultsSample Size For the survey results to be generalized to each of the three separate populations, a significant sample size had to be generated As the population significantly increases, the sample size exponentially decreases: N=100 (S=80%); N=1,000 (S=28%); N=10,000 (S=3.7%); N=100,0000 (S= .04%)
Alumni Marketing Survey ResultsSample Size • Based upon the formula, only the Alumni survey had a significant number of respondents • Alumni (n=504) – Significant • Prospective (n=150) – Not Significant • Current Student (n=60) Not Significant
Measuring Both Importance and Satisfaction • The Importance/Satisfaction procedure measures the importance respondent places on a given attribute as well as how satisfied they are with the service of that same attribute • Using I/S measures gives a lot more information than just satisfaction alone • An important component of the I/S measure is the performance gap which is the mathematical difference between importance and satisfaction • The performance gap indicates where the institution is least meeting student expectations
Access to Faculty Availability of Major Availability of Scholarships Availability of Social Events Close to Home Varsity Athletic Programs Cost to Attend Honors Programs Job Placement Opportunities Leadership Development National and State-Wide Reputation Warm/Friendly Campus Quality of Classroom Facilities Quality of Faculty Quality of Undergraduate Education Safe Campus Selective Admissions Standards Smaller Faculty/Student Ratio Alumni Marketing Survey Results18 Characteristics/Attributes
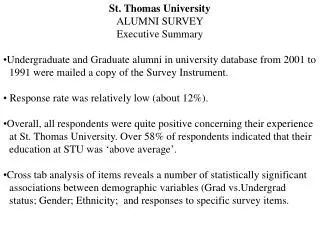
Alumni Marketing Survey ResultsStatistics • Sent to all alumnae with contact information • Over 500 respondents • Over 62 percent were under 50 and over 50 percent graduated before 1990 • Most respondents received their degrees from the Colleges of Business and Education
Alumni Marketing Survey ResultsDemographics, Cont. Over 57 percent of respondents were 40 and over
Alumni Marketing Survey ResultsGap Analysis • Measures both the Importance and Satisfaction of a particular variable or attribute • The Performance Gap is the difference between the Importance Measure and the Satisfaction Measure • The higher the Performance Gap, the least UNA is meeting customer (alumni) expectations
Alumni Marketing Survey Results Interpreting the Radar Chart Meeting Expectations Smaller Gap Larger Gap Exceeding Expectations/Possible Overkill
Alumni Marketing Survey Results Radar Chart on 20 Characteristics Intersection of Importance to Satisfaction. Meeting Expectations Large negative gap. Possible Overkill Large positive gap. Concentrate Here Not Meeting Expectations
Alumni Marketing Survey Results Top Performance Gaps NOTE: Larger gaps mean UNA is least meeting expectations
Alumni Marketing Survey ResultsOpinion Questions • Questions were designed to ask about particular attributes within UNA • Questions were either based on a 1- 7 Likert Scale or by Y/N answers • Likert Scale responses were averaged. The higher the average the more favorable the respondent was toward that attribute
Alumni Marketing Survey ResultsOpen Ended Questions • Respondents were also asked their opinion on certain qualitative questions • These questions were codified and frequency distributions were run • In certain cases, respondents were asked to choose “all that apply,” and some gave more than one answer. This this case the total n may be greater than the respondent rate
Recommendations • Alternate the Current Student Marketing Survey with the NSSE Survey • Continue to administer all three surveys every other year • Work to obtain a statistically significant response rate for each group