Download
1 / 21
210 likes | 336 Views
OH in the Coastal Boundary Layer of Crete: Measurements and Primary Production Rates During MINOS Harald Berresheim 1 , Christian Plass-Dülmer 1 , Thomas Elste 1 , and Nikos Mihalopoulos 2 1 German Weather Service, Meteorological Observatory Hohenpeissenberg, Albin- Schwaiger-Weg 10, Germany

E N D
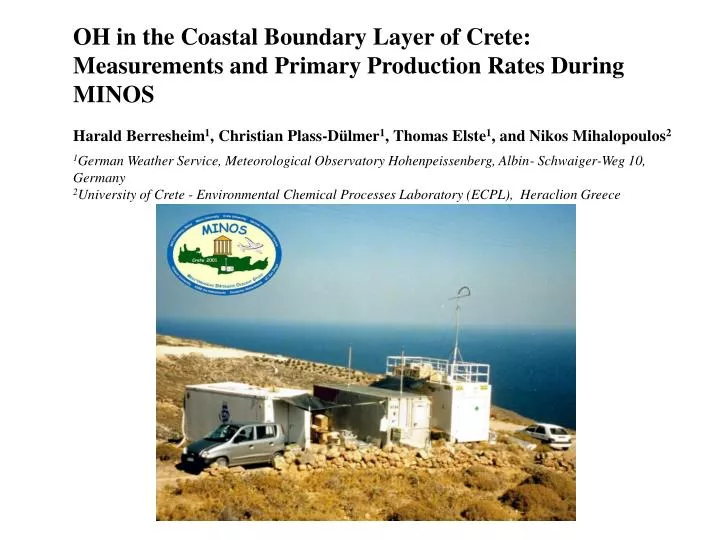
OH in the Coastal Boundary Layer of Crete: Measurements and Primary Production Rates During MINOS Harald Berresheim1, Christian Plass-Dülmer1, Thomas Elste1, and Nikos Mihalopoulos2 1German Weather Service, Meteorological Observatory Hohenpeissenberg, Albin- Schwaiger-Weg 10, Germany 2University of Crete - Environmental Chemical Processes Laboratory (ECPL), Heraclion Greece
Location of Finokalia Station(35°19‘N, 25°40‘E; 100-130 m asl)
multiple steps RO2 ν O3 NO, O2 HO2 Rain multiple steps Sources and Sinks of OH CxHy = Hydrocarbons
CIMS Ionization Reactor MINOS 2001 Station Finokalia Compounds Measured: OH, H2SO4 (gas), MSA (gas) Time Resolution: 30 sec Signal Integration: 5 min Accuracy, Precision, Detection Limit (2σ) : OH: 38 %, 32 %, 2.5 x 10⁵ molec cm-3 H2SO4, MSA: 29%, 21 %, < 1 x 10⁵ molec cm-3
Time-weighted Average , 106 cm-306-12 August: 4.0 ± 0.6 13-21 August: 5.3 ± 0.9 * Total Period: 4.7 ± 1.0 * * excluding 19 August
OH Primary Production Ozone-Photolysis 330 nm J(O1D) O3 + h O(1D) + O2 (1) O(1D) + H2O 2 OH (2) (3) , O(1D) + N2, O2 O( 3P) Primary Production Rate, P(OH)
Conclusions • Mean OH concentration at Finokalia during MINOS: 4.7 x 10⁶ molecules cm-3(Spivakovsky et al., 2000: 2-3 x 106 cm-3, same region, July, 700 hPa; 1.5 x 106 cm-3, 36°N zonal and monthly average, July, 1000 hPa) • Primary production via ozone photolysis and reaction of O(1D) with H2O was the dominant source of OH (R2 = 0.8806) • Fairly good agreement with present model calculations of the regional OH balance during MINOS(e.g., poster by Baboukas et al., oral presentation by Lawrence et al., this session)
Acknowledgement Our sincere thanks to: Jos Lelieveld (MPI), Marian de Reus and the MINOS team, E. Baboukas, M. Lawrence, Pavlos Petsalakis, ECPL staff and students, and Georg Stange (DWD).