Download
1 / 5
50 likes | 53 Views
This report analyzes the trends and geographic patterns of suspicious activity report (SAR) filings in the state of Florida from April 1, 1996, through December 31, 2007. It provides insights into the number and characterizations of SARs, with a specific focus on mortgage loan fraud. Note: The statistical data may vary as new reports are processed.

E N D
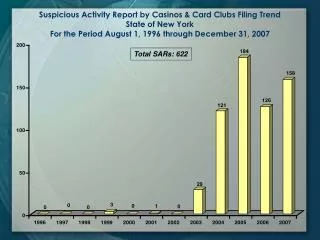
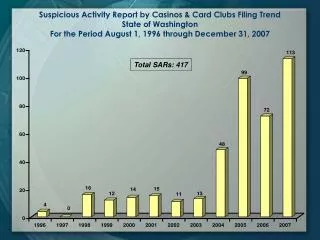
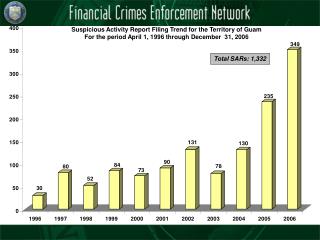
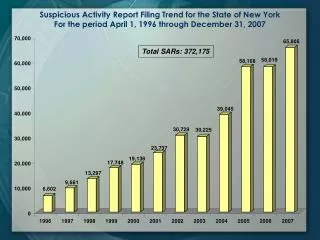
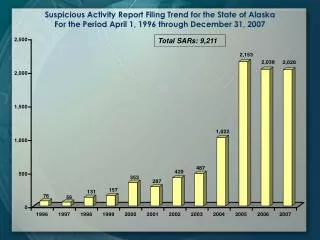
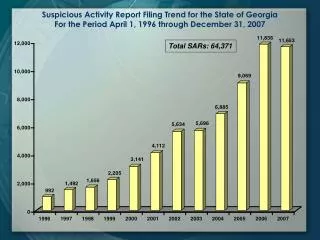
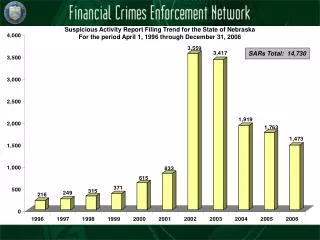
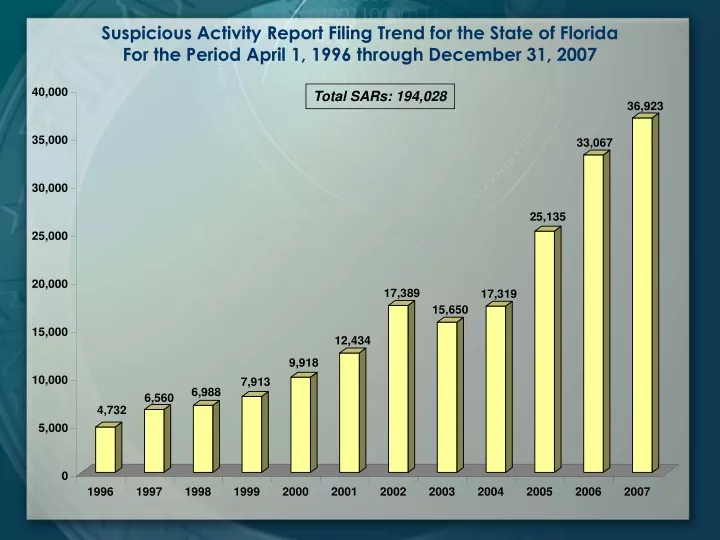
Suspicious Activity Report Filing Trend for the State of FloridaFor the Period April 1, 1996 through December 31, 2007 Total SARs: 194,028
Characterizations of Suspicious Activity for the State of Florida For the Period April 1, 1996 through December 31, 2007 Note: The pie chart represents the top nine characterizations plus additional characterizations in total. An individual SAR may cite more than one characterization. Hence, the number of characterizations detailed here significantly exceeds the total number of SARs.
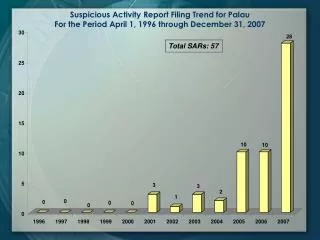
Florida Mortgage Loan Fraud SAR Filing Trend For the period April 1, 1996 through December 31, 2007 Total SARs: 17,852 Note: Suspicious Activity Report statistical data is continuously updated as additional reports are filed and processed. For this reason, there may be minor discrepancies between the statistical figures contained in this report and those in previous FinCEN reports. Annual numbers for this exhibit are calculated by Subject Address and not filer address; therefore, the annual totals appearing in the above graph do not match those in Section 1, Exhibit 8 (Characterization of Suspicious Activity by State & Territory by Year).
Suspicious Activity Report Geographic Pattern for the State of Florida For the Period January 1, 2006 through December 31, 2006 Note: Statistics based on Filer Branch Address
Suspicious Activity Report Geographic Pattern for the State of Florida For the Period January 1, 2007 through December 31, 2007 Note: Statistics based on Filer Branch Address