Download
1 / 22
220 likes | 227 Views
Learn about the importance of earnings per share (EPS) as an investment ratio and how it is calculated. Discover the problems in identifying earnings figures and the number of shares in issue. Explore different bases for computing EPS and understand how dilution affects EPS.

E N D
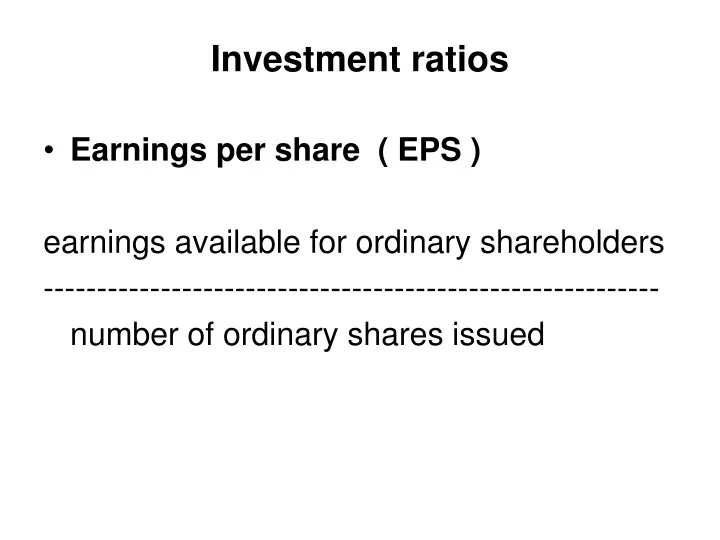
Investment ratios • Earnings per share ( EPS ) earnings available for ordinary shareholders ---------------------------------------------------------- number of ordinary shares issued
EARNINGS PER SHARE [ IAS 33 ] WHY EPS? • Due to use of P/E ratio as a standard stock market indicator Therefore earnings per share should be calculated on comparable bases Worldwide use despite the fact that internationally not comparable due to differences in tax systems
EARNINGS PER SHARE WHAT IS P/E RATIO? Market capitalisation of a company's earnings Price Per Share EPS Price identified on a consistent basis between companies and over time So 'essential ?' that EPS calculation also consistent
EARNINGS PER SHARE WHAT IS EPS? Profit attributable to ordinary shares Number of ordinary shares in issue
EARNINGS PER SHARE consolidated tax minority preference extraordinary profit interests dividends items after after after before Number equity in issue and ranking in respect of of shares for dividend the period weighted average number in issue and ranking
EARNINGS PER SHARE WHAT ARE THE PROBLEMS? • Identification of the earnings figure due to taxation anomalies • Identification of the number of shares in issue particularly when additional shares issued during the year
EARNINGS PER SHARE E.P.S & TAXATION charge: • VARIABLE ITEMS • elements of tax charge which vary according to the amount of profit distributed by way of dividend • eg. deferred tax ? • CONSTANT ITEMS • eg. • corporate tax on income • tax attributable to dividends received • overseas tax unrelieved because the rate of overseas tax exceeds the rate of reporting entity corporate tax
EARNINGS PER SHARE BASES OF COMPUTING EPS • NET BASIS: Takes account of both variable and constant tax items this is the one that is used • NIL BASIS: Takes account only of constant items
EPS AND THE NUMBER OF SHARES 1. NO CHANGE IN ISSUED CAPITAL DURING THE YEAR Number of shares as at balance sheet date 2. SHARES ISSUED AT FULL MARKET PRICE DURING THE YEAR Time weighted average calculation to reflect change in the number of shares NO previous year adjustment
EPS AND THE NUMBER OF SHARES 3. CAPITALISATION / SCRIP / BONUS ISSUE DURING THE YEAR Earnings apportioned over number of shares after capitalisation ie. number at end of year, (at balance sheet date) scale down previous year EPS figure 4. SHARE SPLIT DURING THE YEAR Calculation as in 3. above
EPS AND THE NUMBER OF SHARES 5. SHARE EXCHANGE DURING THE YEAR As consideration for shares in a new subsidiary IF ACQUISITION ACCOUNTING • Profit of subsidiary is brought in from date of acquisition • Therefore number of shares time weighted average based on time of acquisition as in 2. above • No previous year adjustment to EPS
EPS AND THE NUMBER OF SHARES • RIGHTS ISSUE • Normally at less than full market price • use a CALCULATED THEORETICAL EX RIGHTS PRICE [TERP] number of shares before rights x cum-rights price = $X + number of rights shares x rights issue price = $Y ------------- = combined number of shares at a combined price = $Z so TERP = combined price / combined number
EPS AND THE NUMBER OF SHARES • EPS FOR THE YEAR IN WHICH A RIGHTS ISSUE IS MADE • Number of shares is an adjusted weighted average and this "adjusted" number of shares figure is used to divide into earnings
EPS AND THE NUMBER OF SHARES • EPS FOR PRIOR YEARS • multiply old EPS figures by: TERP ‑‑‑‑‑‑‑‑‑‑‑‑‑‑‑‑‑‑‑‑‑‑‑‑‑‑‑‑‑‑‑ Actual cum rights price • Actual cum rights price on the last day of quotation of the shares cum rights. • ie.Closing price on last day being the official middle market quotation published on the following day
DILUTED EPS • WHEN SHARES IN THE FUTURE WILL RANK FOR DIVIDEND 1. Shares already issued but not yet ranking for dividend [ie. a separate class of equity shares] 2. Convertible securities [loan stock and preference] 3. Options or warrants granted to subscribe for equity shares
DILUTED EPS EARNINGS WILL HAVE TO BE SPREAD OVER A LARGER NUMBER OF SHARES • Assume dilution/conversion/subscription • occurs on first day of period or date of issue if later IF CONVERTIBLE LOAN STOCK • earnings will increase • by assumed saving of interest, net of corporate tax IF NEW SHARES UNDER OPTIONS/WARRANTS • earnings adjusted by assuming subscription proceeds had been invested in 2.5% consolidated stock on first day of period at the closing rate of the previous day • Again extra earnings net of tax. ie. return on capital
DILUTED EPS • FULLY DILUTED earnings per share should be shown on the face of the profit and loss account in addition to the BASIC earnings per share on a NET BASIS • If DILUTION is less then 5% of BASIC EPS no need to disclose
EPS EXAMPLES company year end 31 October 19.. earnings for the year £200,000 share capital at 01 November 19.. consisted of £2 million ordinary shares • No change in issued capital EPS = 200,000 = 10p 2 million
EPS EXAMPLES • 500,000 ordinary shares issued at full market price for cash on 1 August 19.. Weighted Average 2m x 9/12 + 2.5m x 3/12 = 1,500,000 + 625,000 EPS = 200,000 = 9.4p 2,125,000 No previous year adjustment Assume that additional capital earns same return as original
EPS EXAMPLES 3. 1 million bonus shares issued during the year (timing is irrelevant) EPS = 200,000 = 6.7p 3 million Scale down previous year 4. Share spilt ie. £1 shares become 50p shares EPS = 200,000 = 5p 4 million Scale down previous year
EPS EXAMPLES 5. Share Exchange 500,000 shares issued on 1 August 19.. Assume profits of subsidiary since acquisition included in earnings figure Weighted Average 2m x 9/12 + 2.5m x 3/12 = 1,500,000 + 625,000 EPS = 200,000 = 9.4p 2.125 million No adjustment to previous year
EPS EXAMPLES 6. Rights Issue 500,000 ordinary shares at 115p per share on 1 May 19.. Market price last day cum rights was 125p per share (2m x 125p) + (0.5m x 115p) TERP = ‑‑‑‑‑‑‑‑‑‑‑‑‑‑‑‑‑‑‑‑‑‑‑‑‑‑‑‑‑‑‑‑‑‑‑‑‑‑‑‑ = 123p 2.5m 4 x 125p = 500p 1 x 115p = 115p ‑‑‑‑‑‑‑‑‑‑‑‑‑‑‑‑ 5 615p ==== therefore = 123p 200,000 EPS = ‑‑‑‑‑‑‑‑‑‑‑‑‑‑‑‑‑‑‑‑‑‑‑‑‑‑‑‑‑‑‑‑‑‑‑‑‑‑‑‑‑‑‑‑‑‑‑‑‑‑‑‑‑‑‑‑‑‑‑‑‑‑‑‑ ( 2m x 6/12 x 125/123 ) + ( 2.5m x 6/12 ) so EPS = 8.8p Adjust previous year EPS by factor 123/125