Download
1 / 3
30 likes | 145 Views
Probabilities and Normal Distributions. If a random variable, x is normally distributed, the probability that x will fall within an interval is equal to the area under the curve in the interval.

E N D
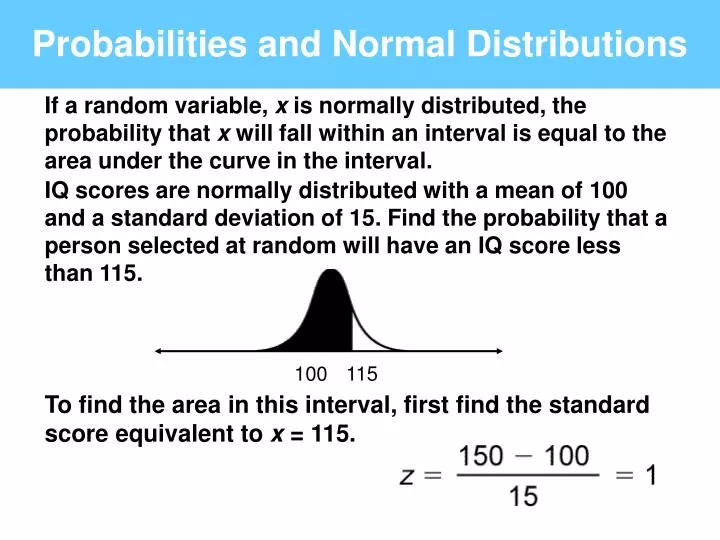
Probabilities and Normal Distributions If a random variable, x is normally distributed, the probability that x will fall within an interval is equal to the area under the curve in the interval. IQ scores are normally distributed with a mean of 100 and a standard deviation of 15. Find the probability that a person selected at random will have an IQ score less than 115. 100 115 To find the area in this interval, first find the standard score equivalent to x = 115.
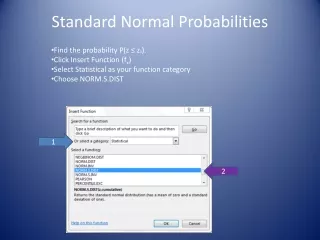
Probabilities and Normal Distributions Normal Distribution Find P(x < 115). 100 115 Standard Normal Distribution SAME SAME Find P(z < 1). 1 0 P(z < 1) = 0.8413, so P(x <115) = 0.8413
Application Normal Distribution Monthly utility bills in a certain city are normally distributed with a mean of $100 and a standard deviation of $12. A utility bill is randomly selected. Find the probability it is between $80 and $115. P(80 < x < 115) P(–1.67 < z < 1.25) 0.8944 – 0.0475 = 0.8469 The probability a utility bill is between $80 and $115 is 0.8469.