Download
1 / 17
170 likes | 307 Views
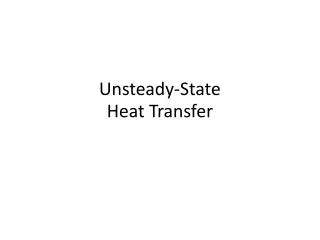
Time series of sea level, precipitation and temperature of Pärnu region. Valter Petersell, Sten Suuroja and Jaan Kivisilla Geological Survey of Estonia May 18-20, 2006 Klaipeda. Location. Narva-Jõesuu. Tallinn. Ristna. Virtsu. Pärnu. Sea level rise.

E N D
Time series ofsea level, precipitation and temperature of Pärnu region Valter Petersell, Sten Suurojaand Jaan Kivisilla Geological Survey of Estonia May 18-20, 2006 Klaipeda
Location Narva-Jõesuu Tallinn Ristna Virtsu Pärnu
Sea level rise The results of SEAREG showed that in the Baltic Sea region in 1950–2000 average annual temperature increased for 0.62 oC (Kropp, 2005). During the above period also the sea level started to rise and by the end of the 21st century the prognosticated maximum actual sea level rise will be approximately 88 cm (Schmidt-Thome, 2005). Such rise of sea level in Estonia was prognosticated as the difference between the global sea level rise on one hand and the local neotectonic movements on the other hand. Considering the neotectonic uplift, the prognosticated maximum sea level rise in the coastal zone in Estonia will be 50–70 cm.
- 0.5 Vertical movements Narva-Jõesuu Tallinn Ristna Virtsu Pärnu Isobases of annual rates (mm/year) of vertical movements in Estonia (Vallner et al, 1988) The neotectonic map of Estonia is based mainly on the results of precise levelling carried out in the 1950s–1960s. Today, these data are being specified on the grounds of recent information.
Neogeodynamics of the Baltic Sea depression and adjacent areas(Garetsky et. al, 2001)
Narva-Jõesuu Tallinn Ristna Virtsu Pärnu Vertical movements During the first stage, our investigations were based on the information presented on the neotectonic movements, long-term time series of sea level fluctuations carried out in different observation points along Estonian coast, and long-term time series of temperature and precipitation. To obtain more objective results, in addition to Pärnu we analysed also the time series of sea level fluctuation from Virtsu, Ristna, Tallinn and Narva-Jõesuu observation points. The results delivered in this presentation are only preliminary and may partly change when the investigations are completed.
Pärnu Sea level 1930-2005 in Pärnu Annual maximum Annual average Annual minimum Annual average Trend of the mesured data (by Kronstadt zero) 10 year avg. Calculated trend according to neotectonic rise (after Vallner et al1988) Sea level rise +15.6 cm NB! On levelling gauges the Kronstadt zero is marked as 500 mm Data from EMHI (Estonian Metereological and Hydrological Institute).
Tallinn Sea level 1930-2005 in Tallinn Annual maximum Annual average Annual minimum Annual average Mesured trend (by Kronstadt zero) 10 year average Calculated trend according to neotectonic rise (after Vallner et al1988) Sea level rise +12.1 cm
Sea level 1930-2005 in Ristna Ristna Annual maximum Annual average Annual minimum Annual average 10 year average Mesured trend (by Kronstadt zero) Calculated trend according to neotectonic rise (after Vallner et al1988) Sea level rise +10.5 cm
Narva-Jõesuu Sea level 1930-2005 in Narva-Jõesuu Annual maximum Annual average Annual minimum Annual average Mesured trend (by Kronstadt zero) 10 year average Calculated trend according to neotectonic rise (after Vallner et al1988) Sea level rise +12.0 cm
Sea level 1930-1995 in Virtsu Virtsu Annual maximum Annual average Annual minimum Annual average 10 year average Mesured trend (by Kronstadt zero) Calculated trend according to neotectonic rise (after Vallner et al1988) Sea level rise +9.6 cm
annual average temprature annual average precipiation Precipitation and temperature in Pärnu area (Coefficient * 1.15) 630 mm 1881-1923 (5,3 °C) 1881-1960(5,2 °C) Measured 549 mm The location of Pärnu meteorological station has been changed three times within up to 3 km – in 1947, 1990 and 2003. These changes are not observable in the time series of temperature and precipitation, but a rise in temperature and amount of precipitation is clearly observable. In 1881–1960 the average temperature was 5.2 oC, among this during 1881–1925 average 5.3 oC. Starting from the 1970s, a rise of temperature was observed and the average of last 15 years reached 6.6 oC, i.e. has risen 1,4 oC. It is likely that the rise will continue. During the last 40 years the precipitation has increased from the annual average of 630 mm up to 750 mm
Sea level and temperature 1930-2005 in Pärnu Temperature annul avg. trendline
Correlations between the major annual average features in Pärnu observation point (correlation coefficients r) There is a clear positive correlation between the average sea level and temperature – the lower the temperature, the lower the sea level. Further analysis of wind rose diagrams will show whether this is due to wind direction. P = 5% when r > 0.32 P = 1% when r > 0.42 P = 0.1% when r > 0.52
12.1 12.0 10.5 9.6 15.6 Average data of sea level, temperature and precipitation time series for 10-year intervals. a – sea level in relation to the Kronstadt zero (measurement results). b – sea level rise calculated after the trend, considering the neotectonic uplift of ground surface, cm * Neotectonic uplift of ground surface in observation point during last 55 years, cm
Conclusions • Compared with the results calculated after the neotectonic map, during the last 50–60 years the sea level has risen in all observation points. • Almost 15–16 cm in Pärnu, 9–11 cm in Virtsu and Ristna, and 12–13 cm in Tallinn and Narva-Jõesuu of sea level rise were fixed. • Small differences are due to some inaccuracy of assessment of the neotectonic uplift on the grounds of the neotectonic map on one hand, and local ground surface subsidence accompanying the complex groundwater consumption (Pärnu, Tallinn, Narva-Jõesuu) on the other hand. • Further investigation is needed to elucidate whether the rate and partly the direction of neotectonic uplift (down sink) has changed, or this is due to sea level rise. • However, it is vitally important to consider these changes in the process of planning and designing.
Thank you for your attention! v.petersell@egk.ee Geological Survey of Estonia Kadaka tee 82, Tallinn 12618 Estonia