Download
1 / 53
530 likes | 928 Views
Understanding the Global Food Situation and Possible Policy Options Robert W. Herdt Cornell-India Food and Agribusiness Management Program June 25, 2009 Rising global food grain prices Sep 2005 to Mar 2008 Monthly world price of commodities Source of raw data: The Pinksheet, World Bank

E N D
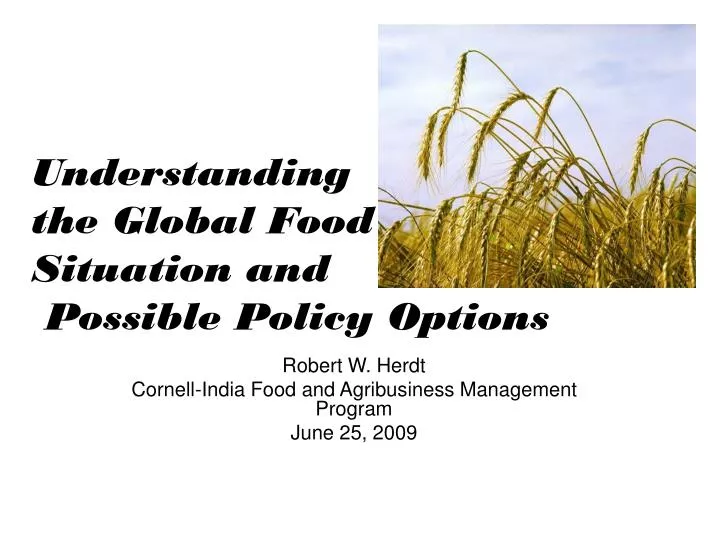
Understanding the Global Food Situation and Possible Policy Options Robert W. Herdt Cornell-India Food and Agribusiness Management Program June 25, 2009
Rising global food grain prices Sep 2005 to Mar 2008 Monthly world price of commodities Source of raw data: The Pinksheet, World Bank RW Herdt June 2009
Why is/was there a crisis? • Long Run Trends set the stage • Abundant production, falling prices • Results: • Declining Investments • Declining research • Declining aid to agriculture • All reduced growth rate of production capacity • Changing Structure of Demand • Short run shocks led to tipping point • Declining stocks => Hoarding • Weather • Inappropriate policies RW Herdt June 2009
Long-run factors • Demand factors • Population – growing but slowing • Income – slowing and accelerating • Preferences – changing • Supply trends • 1965-2000: Sufficient supply => Falling prices • => Declining R&D, Declining Ag investment • Competition for water, land RW Herdt June 2009
Global Population is Growing RW Herdt June 2009 http://www.prb.org/template.cfm?Section=Educators
The rate of population growth is slowing, but there is no certain way to know how large the World’s population will eventually get http://www.prb.org/template.cfm?Section=Educators RW Herdt June 2009
World per capita income 1600-2003: Grew slowly for centuries, recently accelerated (1990 international dollars, Brad DeLong & Angus Maddison) RW Herdt June 2009
…but not at the same rate everywhere (1820-2003; 1990 international dollars) RW Herdt June 2009
World food production grew faster than demand and drove down prices (here, rice) 1961-2000 World Production Real price of milled rice (2008) US$/ton) Production of unmilled rice (million MT) Real price Source: Production: USDA, 14April2008 Rice Price: 2008 is average of Jan-March 2008. Relate to Thai rice 5%-broken deflated by G-5 MUV Index deflator (adjusted based on February 27, 2008 data update) Source: www.,WorldBank.org RW Herdt June 2009
All food commodities prices fell 1960-2001 (international prices,, constant 1990 US$) RW Herdt June 2009
2.5 2.0 1.5 1.0 0.5 0 1960 1990 1965 1970 1975 1985 1995 2005 2000 1980 LR Response 1. Investment in Irrigation World Bank lending (billions of 1990 US dollars) Source: R. Barker RW Herdt June 2009
LR Response 2: Public agricultural R&D D. Byerlee et al., www.worldbank.org/WDR2008 Dobermann, 2008 RW Herdt June 2009
LR Response 3: Aid to ag sub-sectorsOECD 5-year moving average, million $, deflated RW Herdt June 2009 Source: Compiled from OECD
LR Response 3: US aid to Agriculture $ million RW Herdt June 2009
LR Response 4: Food Demand Source: As per capita incomes rise, calorie intake rises at a decreasing rate (105 countries in 1990 and 2000) Source: Lotz-Campen et. al. Agricultural Economics 2008 RW Herdt June 2009
LR Response 4. Income growth is driving demand for high resource-requiring foods Per capita income growth %/yr Per capita consumption kg/yr It takes 3-5 kg grain to produce 1 kg milk or meat RW Herdt June 2009 Sources: World Bank and FAOSTAT
LR Response 4: Food Demand • Tastes and habits are strong, but they DO change • Quantity consumed and tastes change as incomes change • The higher their income, the less people respond to food prices • With high incomes comes reduced demand for grain, increased demand for meat, milk, fruits RW Herdt June 2009
Why is there a crisis now? • Long Run Trends set the stage, but have been slowly changing over decades and hence cannot account for the sudden sharp upswing in 2008 • Abundant production, falling prices • Results: • Declining Investments • Declining research • Declining aid to agriculture • All reduced growth rate of production capacity • Changing Structure of Demand • Short run shocks led to tipping point • Sudden changes in demand • Declining stocks => Hoarding • Financial speculators • Sudden change in supply • Weather • Export “bans” or Import incentives RW Herdt June 2009
Short run factors • Demand for agricultural output • Burning food as fuel – a new demand factor • Upsurge in oil price: reinforces above • Financial speculators • Panic hording • Supply of agricultural output • Weather • Trade restrictions RW Herdt June 2009
USA Corn and Ethanol Production percent Source: Renewable Fuels Association and USDA RW Herdt June 2009
SR factor 1:Ethanol Drivers of ethanol demand in US • Energy Independence and Security Act of 2007 (EISA) mandates renewable fuels production level until 2022. • EISA requires the production of • 13 billion gallons of renewable fuels by 2010 • 36 billion gallons by 2022 – 21 bil “advanced” biofuels • Corn based ethanol capped at 15 billion gallons. Source: Andrew Muhammad and Ellene Kebede, Choices 2009 RW Herdt June 2009
Other advanced countries are using Ethanol RW Herdt June 2009
Are oil prices driving food prices? • Oil is priced in dollars; • when the dollar depreciates against the Euro, Yen, Pound, etc., • oil sellers demand more dollars per bb • to receive the same Euro buying power • Oil at >$critical price/bbl means high-priced gasoline and make crop-based biofuel cost-competitive • Oil <$critical price/bbl means no more than current corn use for ethanol – cannot make a ROI • The “actual” critical price is unknown, maybe $100-$150 • Oil and oil-based fertilizer are important agricultural inputs, so food production costs depend on oil prices in the input-intensive countries RW Herdt June 2009
SR factor 1: Ethanol & Food Demand • Tastes and habits are strong, but they DO change • The higher their income, the less people respond to food prices • Tastes change as incomes change • With high incomes comes reduced demand for grain, increased demand for meat, milk, fruits • Biofuel is a “new” demand for grain and biomass, with characteristics unlike food demand RW Herdt June 2009
SR factor 2:Weathere.g. wheat (tracked by USDA; available on www) U.S. wheat supplies for 2009/10 are lowered 10 mil bu this month Soft red winter wheat, forecast down 7 million bushels; Hard red winter wheat forecast 4 million bushels lower; Small increase in white winter wheat; Use is 20 million bushels lower based on higher projected prices; Ending stocks projected 10 million bushels higher. The 2009/10 average farm price projected $4.90 to $5.90 per bushel Global wheat supplies 2009/10 projected lower 1.6 mil tons this month EU-27 production is lowered 2.3 million tons from lower expected yields in Hungary, Romania, and Spain where dryness has reduced crop prospects. Increases for France and Denmark are partly offsetting. Production for Canada is lowered 1.0 million tons on dryness in Alberta and western Saskatchewan and on unseasonably cool temperatures Ukraine production is reduced 1.0 million tons, persistent April and May dryness Russia production is raised 1.0 million tons on higher area and abundant moisture China is raised 0.5 million tons on higher area North Africa and Syria reflect higher expected yields. Etc… projected use, stocks RW Herdt June 2009
World production and stock data revised monthly; Available on the web RW Herdt June 2009
Grains, cotton, oilseeds USA and World June-Dec (and two earlier years) RW Herdt June 2009
SR Impact Factor: Weather - Typhoon RW Herdt June 2009
Recent reports in Science by visitors indicate rice production in Burma has recovered. RW Herdt June 2009
SR Impact 3: Grain Stocks & Expectations RW Herdt June 2009
SR impact 3:Declining rice stocks 2000s 1990s Source of raw data: PSD Online (www.fas.usda.gov/psdonline/psdhome.aspx), USDA, 2008 RW Herdt June 2009
SR Impact 3: Global stocks Source: USDA RW Herdt June 2009
SR Impact 4: Trade, speculation? • Export restrictions (as of April 2008) imposed by: • India, Pakistan, China, Vietnam • Argentina, Bangladesh, Bolivia, Cambodia, Egypt, Ethiopia, Kazakhstan, Malaysia, Russia, Tanzania, Zambia • Reduced import barriers • A move to open trade, added upward pressure on prices. • Morocco cut tariffs on wheat imports from 130 to 2.5%; • Nigeria slashed duties on rice imports from 100 to 2.7%; • Peru removed import taxes on wheat and maize; and • Senegal waived duties on cereal imports. • Statistical tests to determine the role of speculative activity in commodity prices. See next slide: Source: Von Braun and Torero; Choices 2009 RW Herdt June 2009
SR Impact 4: Speculation in commodity trading markets? Evidence Source: Von Braun and Torero, Choices 2009 RW Herdt June 2009
SR Impact 4: Trade, speculation? • Export restrictions (as of April 2008) imposed by: • Argentina, Bangladesh, Bolivia, Cambodia, China, Egypt, Ethiopia, India, Kazakhstan, Malaysia, Pakistan, Russia, Tanzania, Vietnam, and Zambia – some are major exporters • Reduced import barriers • A move to open trade, added upward pressure on prices. • Morocco cut tariffs on wheat imports from 130 to 2.5%; • Nigeria slashed duties on rice imports from 100 to 2.7%; • Peru removed import taxes on wheat and maize; and • Senegal waived duties on cereal imports. • Statistical tests to determine the role of speculative activity in commodity prices. See next slide: • 6 of 24 statistical tests suggest that speculation might have been influential – 18 of 24 do not support the suggestion Source: Von Braun and Torero; Choices 2009 RW Herdt June 2009
SR Impact 5: Policy irrationality (one of many!)(Slayton and Timmer, 2008) • Japan imports US rice under WTO pressure • Japanese consumers don’t like US rice • Japanese government doesn’t want them to become accustomed to US rice • Japanese government stores rice until it is OK only for livestock feed • Hence, Japan has stock it could export, but, under WTO rules: • Japan must have US “permission” to re-export rice, even in time of “crisis” RW Herdt June 2009
Markets react sharply to SR factors (rice prices) Monthly export price of Thai rice 5% brokens, 1990-2008 (January 1990 to March 2008) 1990s 2000s Source of raw data: The Pinksheet, World Bank RW Herdt June 2009
Why does all this matter so much? The New York Times: Editorial RW Herdt June 2009
Fortunately, entire world price increase is not passed through to domestic markets:Percent of 2003-06 world rice price increase passed through RW Herdt June 2009 Source: Dawe, FAO ESA Working Paper 08-03
Impact of 50% price increase of staples on high and low income consumers Source: Trostle 2008 RW Herdt June 2009
Impact of 50% price increase of staples on high and low income consumers RW Herdt June 2009 Source: Trostle, 2008
But, high global prices increase food aid costs and hurt hungry people Source: FAO State of Food and Agriculture and State of Food Insecurity RW Herdt June 2009
LR and SR factors led to sharply moving prices 2007-2009 World Bank’s reported monthly world price of commodities Crude Oil RW Herdt June 2009 Source of dada: http://siteresources.worldbank.org/INTDAILYPROSPECTS/Resources/Pnk_0709.xls and later
Have grain prices permanently increased? Nominal monthly farm price of corn in Illinois, January 1947 – January 2009 and projected future range Source: Choices; Scott H.Irwin and Darrel L.Good, 2009 RW Herdt June 2009
Have grain prices permanently increased? Quantitative analysis conclusions • First: Likely that there has been a permanent shift in the level of corn, soybean, and wheat prices. • Size? • Second: Peak prices since December 2006 were well above average prices projected; even higher prices might occur. • Third: Prices might still move to “low” levels and might stay there for considerable periods. • Fourth: A new era of crop price levels and volatility has begun. Source: Irwin & Good, Choices, 2009 RW Herdt June 2009
Monday, July 2 A Rice Crisis Is Boiling Rice is life itself in Southeast Asia, and this year, there is not enough to go around. Last year’s bad weather has turned the region’s usual bare sufficiency into severe shortage. The result: smuggling, hoarding, soaring prices and hungry people. RW Herdt June 2009
A Rice Crisis Is Boiling Monday, July 02, 1973 Rice is life itself in Southeast Asia, and this year, there is not enough to go around. Last year’s bad weather has turned the region’s usual bare sufficiency into severe shortage. The result: smuggling, hoarding, soaring prices and hungry people. Thanks to Randy Barker! RW Herdt June 2009
World Rice Market: A Special Case? RW Herdt June 2009 Source: USDA
Policy responses? • Eliminate artificial trade barriers • Provide emergency food assistance • Allow price signals to do their “work” • Reduce subsidies to ethanol • Eliminate mandated blending of ethanol • Reinvigorate global agricultural research • Build infrastructure and institutions in SS Africa • Direct agricultural research aid to SS Africa RW Herdt June 2009