Download
1 / 13
130 likes | 341 Views
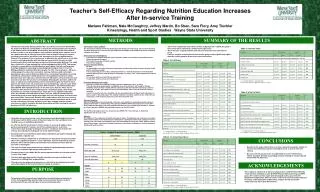
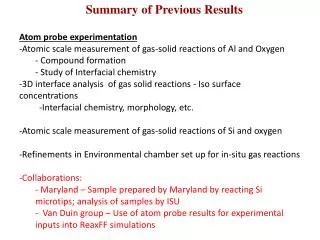
University of Washington Former Hanford Worker Medical Monitoring Program. Summary of Screening Exam Results (thru 9/30/2006) Phase II Year 8 Quarter 3, 2006. Find UW Hanford Activities at: http://depts.washington.edu/fmrwrkr. Worker’s Demographics N=2,492 workers with exam(s).

E N D
University of Washington Former Hanford Worker Medical Monitoring Program Summary of Screening Exam Results (thru 9/30/2006) Phase II Year 8 Quarter 3, 2006 Find UW Hanford Activities at: http://depts.washington.edu/fmrwrkr University of Washington Occupational and Environmental Medicine Program
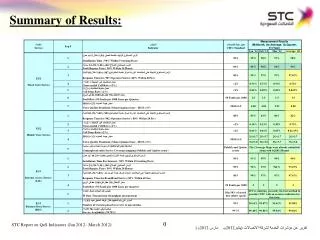
Worker’s Demographics N=2,492 workers with exam(s) Male 2,008 (80.6%) Female 484 (19.4%) Race Number Percent Tested Missing 214 8.6% White 2120 85.1% Black 52 2.1% Asian 19 0.8% Hispanic 42 1.7% American Indian/ Alaska Native 26 1.0% Other 19 0.8% University of Washington Occupational and Environmental Medicine Program
Medical Exam ResultsN=2,492 workers with exam(s) *Includes number of workers with an abnormal finding at one or more exam visits University of Washington Occupational and Environmental Medicine Program
Exam Results: Spirometry Spirometry results available for 2,369 workers Number of Workers Below 80% at one or more exam visits: FEV1 877 (37.0%) FVC 740 (31.2%) Respiratory Dysfunction by Category Number of Workers* Obstructive 409 (17.3%) Restrictive 376 (15.9%) Mixed 201 (8.5%) *Includes number of workers with said Respiratory Dysfunction at one or more exam visits University of Washington Occupational and Environmental Medicine Program
Exam Results: Spirometryfor Workers with Asbestos Exposure N = 781 for low category, 326 for medium category, and 307 for high category University of Washington Occupational and Environmental Medicine Program
Exam Results: AudiometryN=1,828 workers with audiogram • Hearing Exams 1,377 of 1,828 (75.3%)have hearing loss which warrants follow-up Mean dB Threshold by Frequency Hz. Mean Threshold 500 17.79 1000 18.66 2000 25.57 3000 37.30 4000 46.68 6000 54.17 University of Washington Occupational and Environmental Medicine Program
Exam Results: AudiometryAMA Guides to the Evaluation of Permanent Impairment University of Washington Occupational and Environmental Medicine Program
Exam Results: Chest RadiographsN=2,382 workers with CXR *0/0 includes those scored as “No parenchymal abnormalities consistent with pneumoconiosis” **Workers with more than one CXR were assigned the ILO score of their “worst case” CXR University of Washington Occupational and Environmental Medicine Program
Exam Results: Chest RadiographsN=2,382 workerswith CXR Evidence of Pleural Plaques in 434 (18.2%) workers *Includes number of workers with said finding at one or more exam visits University of Washington Occupational and Environmental Medicine Program
L&I Claims Recommended N=2,492 workers with exam(s) • Workers with Claims Recommended: • 561 Asbestos Claims • 90 Beryllium Claims • 874 Hearing Claims *Includes number of workers with claim recommended at one or more exam visits University of Washington Occupational and Environmental Medicine Program
Smoking History N=2,270 Workers with both exam and smoking history available Ever Smoke 1,376 (60.6%) Smoke now 233 (10.3%) Packyears of Smoking, Average number of packs per day * Years of smoking Mean 25.70 Packyears Standard Deviation 22.60 Range 1-183 University of Washington Occupational and Environmental Medicine Program
Beryllium Positive* Of 75 workers with at least one positive LPT 1 ILO Perfusion Score 1/0 or greater Respiratory Dysfunction Category: 9 Obstructive 15 Restrictive 2 Mixed *Includes number of workers with said positive LPT and/or Respiratory Dysfunction at one or more exam visits University of Washington Occupational and Environmental Medicine Program
Age of Workers at Exam N=2,492 workers with exam(s) University of Washington Occupational and Environmental Medicine Program