Download
1 / 1
10 likes | 123 Views
A Model Comparison for Predicting Anxiety and Depression ??? ? ??? University of Nebraska—Lincoln. Introduction. Results. Table 1: Univariate Statistics.

E N D
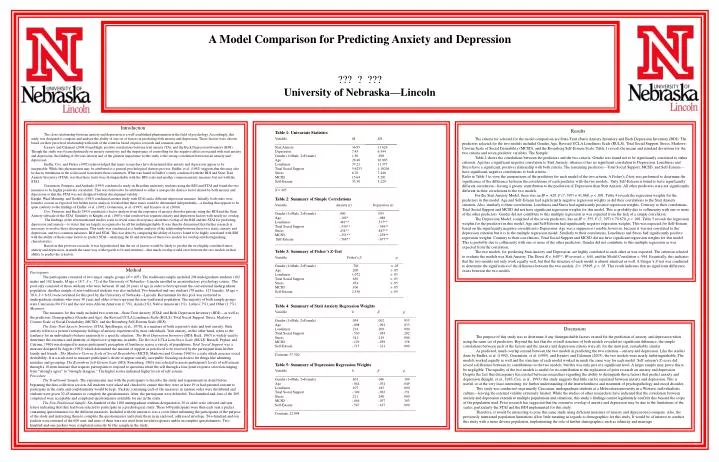
A Model Comparison for Predicting Anxiety and Depression ??? ? ??? University of Nebraska—Lincoln Introduction Results Table 1: Univariate Statistics The close relationship between anxiety and depression is a well-established phenomenon in the field of psychology. Accordingly, this study was designed to compare and analyze the ability of one set of factors in predicting both anxiety and depression. These factors were chosen based on their perceived relationship with each of the criterion based on prior research and common sense. Isyanov and Calamari (2004) found high, positive correlations between trait anxiety (TA), and the Beck Depression Inventory (BDI). Though the study was focused primarily on anxiety sensitivity and the importance of controlling for the negative affect associated with trait anxiety and depression, the finding of obvious interest and of the greatest importance to this study is the strong correlation between trait anxiety and depression. Endler, Cox, and Parker (1992) acknowledged that many researchers have determined that anxiety and depression appear to be inseparable. While this phenomenon may be attributed to a general psychological distress process, Endler, et al. (1992) suggests that this may also be due to limitations in the scales used to measure these constructs. What was found in Endler’sstudyconducted with the BDI and State-Trait Anxiety Inventory (STAI), was that these traits were distinguishable with the BDI scale and another common anxiety measure, but not with the STAI. Gorenstein, Pompeia, and Andrade (1995) conducted a study on Brazilian university students using the BDI and STAI and found the two measures to be highly positively correlated. This was believed to be attributed to either a nonspecific distress factor shared by both anxiety and depression or that the STAI was not designed without discriminant validity. Knight, Waal-Manning, and Godfrey (1983) conducted another study with STAI and a different depression measure. Initially, both traits were found to coexist as expected, but further factor analysis revealed that these states could be determined independently—a finding that appears to be quite contrary to the findings of Endler, et al. (1992), Gorenstein, et al. (1995), and Isyanov, et al. (2004). Cox, Swinson, and Kuch (1993) conducted a factor analysis from the responses of anxiety disorder patients using the BDI and the State Anxiety subscale of the STAI. Similarly to Knight, et al. (1983), what resulted was separate anxiety and depression factors with nearly no overlap. The findings of the aforementioned studies seem to reveal some discrepancy about the overlap of the BDI and the STAI for predicting depression and anxiety—to states that are largely recognized to be all but indistinguishable. It was thereby determined that further research is necessary to resolve these discrepancies. This study was conducted as a further analysis of the relationship between these two states, anxiety and depression, and two common measures, BDI and STAI. This was done by comparing the ability of factors found to be highly correlated with BDI with the ability of these same factors to predict STAI—analyzing the fit and structure of these two models for overlap and distinguishing characteristics. Based on this previous research, it was hypothesized that the set of factors would be likely to predict the two highly correlated states, anxiety and depression, in much the same way with regards to fit and structure—that much overlap would exist between the two models in their ability to predict the criterion. Variable M SD __________________ Stait Anxiety 36.95 11.626 Depression 7.45 6.544 Gender (1=Male, 2=Female) 1.56 .498 Age 28.48 10.885 Loneliness 37.21 11.377 Total Social Support 5.6233 1.18204 Stress 8.70 7.448 MCSD 15.64 5.281 Self-Esteem 33.30 5.229 ____________________________________________________________________ N = 405 The criteria for selected for the model comparison are State-Trait (Stait) Anxiety Inventory and Beck Depression Inventory (BDI). The predictors selected for the two models included Gender, Age, Revised UCLA Loneliness Scale (RULS), Total Social Support, Stress, Marlowe-Crowne Scale of Social Desirability (MCSD), and the Rosenberg Self-Esteem Scale. Table 1 reveals the means and standard deviations for the two criteria and seven predictor variables. The Sample Table 2 shows the correlations between the predictors and the two criteria. Gender was found not to be significantly correlated to either criterion. Age has a significant negative correlation to Stait Anxiety, whereas it has no significant correlation to Depression. Loneliness and Stress have a significant, positive relationship with both criteria. The remaining predictors—Total Social Support, MCSD, and Self-Esteem—have significant, negative correlations to both criteria. Refer to Table 3 to view the comparisons of the predictors for each model of the two criteria. A Fisher’s Z-test was performed to determine the significance of the difference between the correlations of each predictor with the two models. Only Self-Esteem is found to have significantly different correlation—having a greater contribution to the prediction of Depression than Stait Anxiety. All other predictors were not significantly different in their correlations to the two models. For the Stait Anxiety Model, there was an R² = .420, F (7, 397) = 41.068, p < .001. Table 4 reveals the regression weights for the predictors in this model. Age and Self-Esteem had significantly negative regression weights as did their correlations to the Stait Anxiety criterion. Also, similarly to their correlations, Loneliness and Stress had significantly positive regression weights. Contrary to their correlations, Total Social Support and MCSD did not have significant regression weights for this model. This is probably due to collinearity with one or more of the other predictors. Gender did not contribute to this multiple regression as was expected from the lack of a simple correlation. The Depression Model, comprised of the seven predictors, has an R² = .555, F (7, 397) = 70.670, p < .001. Table 5 reveals the regression weights for the predictors in this model. Age and Self-Esteem had significantly negative regression weights. This was expected for Self-Esteem based on the significantly negative correlation to Depression. Age was a suppressor variable, however, because it was not correlated to the depression criterion but it is to the multiple regression model. Similarly to their correlations, Loneliness and Stress had significantly positive regression weights. Contrary to their correlations, Total Social Support and MCSD did not have significant regression weights for this model. This is probably due to collinearity with one or more of the other predictors. Gender did not contribute to this multiple regression as was expected from the correlation. The two models, for predicting Stait Anxiety and Depression, are highly correlated to each other as was expected. The criterion selected to evaluate the models was Stait Anxiety. The Direct R = .648**, R²-crossed = .644, and the Model Correlation = .994. Essentially, this indicates that the two models not only work equally well, but that the structure of each model is almost identical as well. A Steiger’s Z-test was conducted to determine the significance of the difference between the two models, Z = .95895, p > .05. This result indicates that no significant difference exists between the two models. Table 2: Summary of Simple Correlations Variable Anxiety (r)Depression (r) ____________ Gender (1=Male, 2=Female) .000 .055 Age -.102* -.088 Loneliness .481** .537** Total Social Support -.330** -.369** Stress .434** .487** MCSD -.251** -.258** Self-Esteem -.568** -.677** _____________________________________________________________________ Table 3: Summary of Fisher’s Z-Test Variable Fisher’s Z p Gender (1=Male, 2=Female) .781 > .05 Age .200 > .05 Loneliness 1.072 > .05 Total Social Support .630 > .05 Stress .954 > .05 MCSD .106 > .05 Self-Esteem 2.538 < .05 ________________________________________________________________________ Method Participants The participants consisted of two major sample groups (N = 405). The traditional sample included 204 undergraduate students (102 males and 102 female, M age = 18.7, S = .72) at the University of Nebraska—Lincoln enrolled in an introductory psychology course. The pool only consisted of those students who were between 18 and 20 years of age in order to best represent the conventional undergraduate population. Another sample of non-traditional students was also included. Two-hundred-and-one students (78 males, 123 females, M age = 38.4, S = 6.63) were recruited for this pool by the University of Nebraska—Lincoln. Recruitment for this pool was restricted to undergraduate students who were 30 years and older to best represent the non-traditional population. The majority of both sample groups were Caucasian (94.1%) and the rest were African American (1.5%), Asian (1%), Native American (1%), Latino (.7%), and Other (1.7%). Measures The measures for this study included two criterion—State-Trait Anxiety (STAI) and Beck Depression Inventory (BDI)—as well as the predictors, Demographics (Gender and Age), the Revised UCLA Loneliness Scale (RULS), Total Social Support, Stress, Marlowe-Crowne Scale of Social Desirability (MCSD), and the Rosenberg Self-Esteem Scale (SES). The State-Trait Anxiety Inventory (STAI; Spielberger, et al., 1970), is a measure of both a person’s state and trait anxiety. State anxiety refers to a person’s temporary feelings of anxiety experienced by most individuals. Trait anxiety, on the other hand, refers to the tendency for an individual to behave anxiously to a specific situation. The Beck Depression Inventory (BDI; Beck, 1967) is widely used to determine the existence and intensity of depressive symptoms in adults. The Revised UCLA Loneliness Scale (RULS; Russell, Peplau, and Cutrona, 1980) was designed to assess participant’s perception of loneliness across a variety of populations. Total Social Support was a measure designed by Argyle (1992) which determined the amount of support as perceived to be received by the participant from his/her family and friends. The Marlowe-Crowne Scale of Social Desirability (MCSD; Marlowe and Crowne 1960) is a scale which assesses social desirability. It is a scale used to measure participant’s desire to appear socially acceptable focusing on desires for things like admitting mistakes and gossiping. The Rosenberg Self-Esteem Scale (SES; Rosenberg, 1965) was selected to assess participant’s levels of self-esteem through a 10-item measure that requires participants to respond to questions about the self through a four-point response selection ranging from “strongly agree” to “strongly disagree.” The higher scores indicated higher levels of self-esteem. Procedure The Traditional Sample. The experimenter met with the participants to describe the study and requirements in detail before beginning the data-collection session. All students were asked and checked to ensure that they were at least 19 or had parental consent to participate in the study and confidentiality would be kept. Packets containing each of the measures in random order were distributed and students were given 30-45 minutes to complete the questionnaires. After, the participants were debriefed. Two-hundred-and-four of the 209 completed were acceptable and completed questionnaires available for use in the study. The Non-Traditional Sample. Six-hundred of the 1100 undergraduate students designated as 30 or older were selected and sent letters indicating that they had been selected to participate in a psychological study. These 600 participants were then each sent a packet containing questionnaires for the different measures. Included with the measures was a cover letter informing the participants of the purpose of the study and instructing them to complete the questionnaires and return them in an enclosed, addressed envelope. Two-hundred-and-ten packets were returned of the 600 sent, and nine of them were not used from invalid responses and/or incomplete questionnaires. Two-hundred-and-one packets were completed correctly by this sample in the study. Table 4: Summary of Stait Anxiety Regression Weights Variable b β p Gender (1=Male, 2=Female) .054 .002 .953 Age -.098 -.091 .033 Loneliness .214 .209 .000 Total Social Support -.530 -.054 .282 Stress .341 .219 .000 MCSD -.129 -.059 .158 Self-Esteem -.715 -.321 .000 _______________________________________________________________________________ Constant: 57.520 Discussion The purpose of this study was to determine if any distinguishable factors existed for the prediction of anxiety and depression when using the same set of predictors. Beyond the fact that the overall structure of both models revealed no significant difference, the simple correlations between each of the factors and the anxiety and depression criteria were all, for the most part, remarkably similar. As predicted, much overlap existed between the two models in predicting the two criterion—anxiety and depression. Like the studies done by Endler, et al. (1992), Gorenstein, et al. (1995), and Isyanov and Calamari (2003), the two models were nearly indistinguishable. The models worked equally as well and the structure of each model worked in much the same way for each model. Self-esteem’s Z-score did reveal a difference between its contributions to the two models, but this was only just at a significant level. A larger sample may prove this to be negligible. The equality of the two models is useful for its contribution to the replication of prior research on anxiety and depression. Despite the fact that discrepancy has existed between researchers regarding the ability to distinguish those factors that predict anxiety and depression (Knight, et al., 1983, Cox, et al., 1993) this study suggests that little can be separated between anxiety and depression. This is useful, or at the very least interesting, for further understanding of the interrelatedness and treatment of psychopathology and mood disorder. This study was conducted on primarily Caucasian, undergraduate students at a Midwestern university in a Western, individualistic culture—leaving the external validity extremely limited. While the studies of other researchers have indicated that the correlation between anxiety and depression extends to multiple populations and situations, this study’s findings cannot legitimately confirm this beyond the scope of the population used. Prior research has suggested that the extensive overlap of anxiety and depression may be due to the limitations of the scales, particularly the STAI and the BDI implemented for this study. Therefore, it would be interesting to pose this same study using different measures of anxiety and depression to compare. Also, the previously mentioned population limitations allow little meaning in regards to demographics for this study. It would be of interest to conduct this study with a more diverse population, implementing the role of further demographics such as ethnicity and marriage Table 5: Summary of Depression Regression Weights Variable b β p Gender (1=Male, 2=Female) .601 .046 .189 Age -.044 -.074 .049 Loneliness .107 .185 .000 Total Social Support -.349 -.063 .151 Stress .211 .240 .000 MCSD -.046 -.037 .303 Self-Esteem -.547 -.437 .000 _______________________________________________________________________________ Constant: 22.894