Download
1 / 38
380 likes | 385 Views
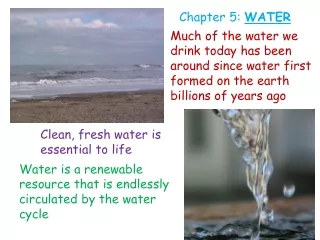
CHAPTER 5 Water and Seawater. H 2 O molecule. One hydrogen H and two oxygen O atoms bonded by sharing electrons Both H atoms on same side of O atom Dipolar. Hydrogen bonding. Polarity means small negative charge at O end Small positive charge at H end

E N D
H2O molecule • One hydrogen H and two oxygen O atoms bonded by sharing electrons • Both H atoms on same side of O atom • Dipolar
Hydrogen bonding • Polarity means small negative charge at O end • Small positive charge at H end • Attraction between + and – ends of water molecules to each other or other ions Fig. 5.3
Hydrogen bonding • Hydrogen bonds are weaker than covalent bonds but still strong enough to result in • High surface tension • High solubility of chemical compounds in water • Solid, liquid, gas at Earth’s surface • Unusual thermal properties • Unusual density
Changes of state due to adding or subtracting heat • Heat is energy of moving molecules • Calorie is amount of heat needed to raise the temperature of 1 gram of water by 1o C • Temperature is measurement of average kinetic energy
Unusual thermal properties of H2O • H2O has high boiling point • H2O has high freezing point • Most H2O is in the form of water (liquid) on Earth’s surface (good for life) • High latent (hidden) heats of • Vaporization/condensation • Melting/freezing • Evaporation
Unusual thermal properties of H2O • Water high heat capacity • Amount of heat required to raise the temperature of 1 gram of any substance 1o C • Water can take in/lose lots of heat without changing temperature • Rocks low heat capacity • Rocks quickly change temperature as they gain/lose heat
Global thermostatic effects • Moderate temperature on Earth’s surface • Equatorial oceans (hot) don’t boil • Polar oceans (cold) don’t freeze solid • Marine effect • Oceans moderate temperature changes day/night; different seasons • Continental effect • Land areas have greater range of temperatures day/night and during different seasons
Density of water • Density of water increases as temperature decreases • Density of ice is less than density of water • From 4oC to 0oC density of water decreases as temperature decreases
Density of water Fig. 5.10
Salinity • Total amount of solid material dissolved in water- Traditional definition • Typical salinity is 3.5% or 35o/oo o/oo or parts per thousand (ppt) = grams of salt per kilogram of water g/Kg Six elements make up 99% of dissolved solids in seawater Fig. 5.12
Measuring salinity • Evaporation • Chemical analysis - titration • Principle of constant proportions • Major dissolved constituents in same proportion regardless of total salinity • Measure amount of halogens (Cl, Br, I, F) (chlorinity) • Salinity = 1.80655 * Chlorinity (ppt) • Electrical conductivity • Salinometer
Salinity variations • Open ocean salinity 33 to 38 o/oo • Coastal areas salinity varies more widely • Influx of freshwater lowers salinity or creates brackish conditions • Greater rate of evaporation raises salinity or creates hypersaline conditions • Salinity may vary with seasons (dry/rain)
How to change salinity • Add water • Remove water • Add dissolved substances • Remove dissolved substances
Precipitation (rain or snow) Runoff (river flow) Melting icebergs Melting sea ice Evaporation Formation of sea ice Processes that add/subtract water from oceans Salinity increases through: Salinity decreases through:
Hydrologic cycle describes recycling of water near Earth’s surface Fig. 5.15
River flow Volcanic eruptions Atmosphere Biologic interactions Salt spray Chemical reactions at seawater-sea floor interface Biologic interactions Evaporite formation Adsorption Processes that add/subtract dissolved substances Salinity increases through: Salinity decreases through:
Residence time • Average length of time a substance remains dissolved in seawater • Ions with long residence time are in high concentration in seawater • Ions with short residence time are in low concentration in seawater • Steady state condition
Residence time and steady state Fig. 5.16
Acidity and alkalinity • Acid releases H+ when dissolved in water • Alkaline (or base) releases OH- • pH scale measures the hydrogen ion concentration • Low pH value, acid • High pH value, alkaline (basic) • pH 7 = neutral
Carbonate buffering • Keeps ocean pH about same (8.1) • pH too high, carbonic acid releases H+ • pH too low, bicarbonate combines with H+ • Precipitation/dissolution of calcium carbonate CaCO3 buffers ocean pH • Oceans can absorb CO2 from atmosphere without much change in pH
Carbonate buffering Fig. 5.18
Surface ocean variation of salinity • Polar regions: salinity lower, lots of rain/snow and runoff • Mid-latitudes: salinity higher, high rate of evaporation • Equator: salinity lower, lots of rain • Thus, salinity at surface varies primarily with latitude
Surface ocean variation of salinity Fig. 5.21
Deep ocean variation of salinity • Surface ocean salinity is variable • Deeper ocean salinity is nearly the same (polar source regions for deeper ocean water) • Halocline, rapid change of salinity with depth
Salinity versus depth Fig. 5.22
Density of seawater • 1.022 to 1.030 g/cm3 surface seawater • Ocean layered according to density • Density seawater controlled by temperature, salinity, and pressure • Most important influence is temperature • Density increases with decreasing temperature
Density of seawater • Salinity greatest influence on density in polar oceans • Polar ocean is isothermal
Density versus depth • Density differences cause a layered ocean • Pycnocline, abrupt change of density with depth • Thermocline, abrupt change of temperature with depth
Layered ocean • Mixed surface water • Pycnocline and thermocline • Deep water • High latitude oceans • Isothermal • Isopycnal
Desalination processes • Remove salt from seawater • Distillation--most common process • Electrolysis • Reverse osmosis • Freeze separation