Download
1 / 7
70 likes | 167 Views
Probability and Simulation. Rules in Probability. Probability Rules. 1. Any probability is a number between 0 and 1 0 ≤ P[A] ≤ 1 2. The sum of all the probabilities of all possible outcomes must equal 1. P[S] = 1

E N D
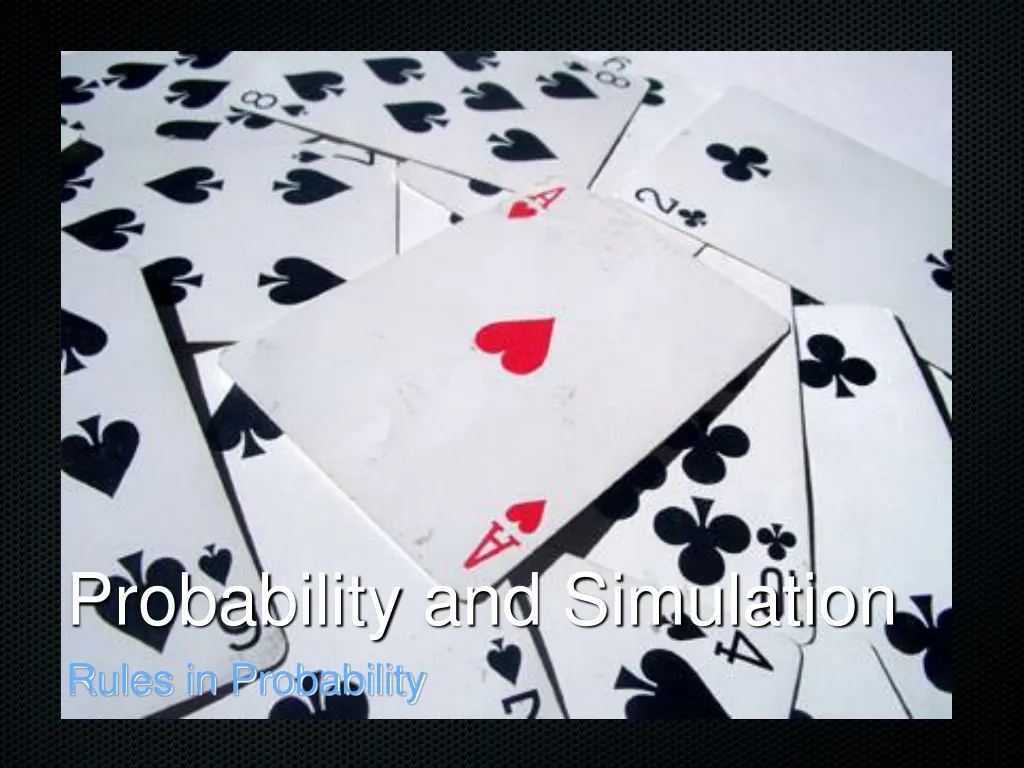
Probability and Simulation • Rules in Probability
Probability Rules • 1. Any probability is a number between 0 and 1 • 0 ≤ P[A] ≤ 1 • 2. The sum of all the probabilities of all possible outcomes must equal 1. • P[S] = 1 • 3. If two events have no outcomes in common, the probability that the one or the other occurs is the sum of their individual probabilities. • P[A or B] = P[A] + P[B] • 4. The probability that an event does not occur is 1 minus the probability that the event does occur. • P[A’] = 1 - P(A)
Probability Rules (Examples) • 1. 0 ≤ P[A] ≤ 1: any proportion is always between 0 and 1 • 2. P[S] = 1 : probability of getting 1, 2, 3, 4, 5, or 6 in tossing a die is ⅙+⅙+⅙+⅙+⅙+⅙= 6/6 or 1 • 3. P[A or B] = P[A] + P[B]: tossing a coin 3 times A: getting all tails B: getting all heads P[A or B] = ⅛ + ⅛ = 2/4 or ¼ • 4. P[A’] = 1 - P(A): Probability of getting A in AP Stat is 20% therefore, the probability of NOT getting an A in AP Stats is 80%
Draw a woman aged 25 - 34 years old at random and record her marital status. If we drew many women, this is the proportion we would get. Here’s the probability model: P(not married) = 1-P(married) = 1 - 0.622 = 0.378 Therefore there are 37.8% of women that are NOT married
P(never married or divorced) = P(never married) + P(divorced) = 0.298 +0.075 = 0.373 Therefore there are 37.3% of women in this group that are either never married or divorced
Venn Diagram S A A B A’ Disjoint events A and B (mutually exclusive events) A’ = complement of A
P [A ∩ B] P [A ∪ B] P[A or B ] = P[A] + P[B] P[A and B ] = P[A] x P[B] Addition Rule of union event Multiplication Rule of Independent Variables Ex: Probability of getting getting a 4 and then another 4 when you roll a die twice Ex: Probability of getting a sum of 3 and probability of getting a sum of 5 when you roll a pair of dice P[A or B] = 2/36 + 4/36 P[A and B] = 1/6 x 1/6 = 1/36 = 6/36 = 17% = 2.8%