Download
1 / 49
520 likes | 585 Views
5. 1. Inventory Concepts. INVENTORY IS A LARGE AND COSTLY INVESTMENT. “Every management mistake ends up in inventory.” Michael C. Bergerac Former Chief Executive

E N D
5 1 Inventory Concepts
INVENTORY IS A LARGE AND COSTLY INVESTMENT “Every management mistake ends up in inventory.” Michael C. Bergerac Former Chief Executive Revlon, Inc.
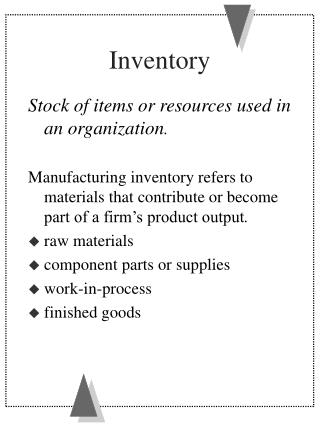
What are Inventories? • Finished product held for sale • Goods in warehouses • Work in process • Goods in transit • Any owned or financially controlled raw material, work in process, and/or finished good or service held in anticipation of a sale but not yet sold CR (2004) Prentice Hall, Inc.
Inventory Holding costs (inventory Carrying Costs) Customer Service , i.e., Stock Availability Inventory Management Objectives Good inventory management is a careful balancing act between stock availability and the cost of holding inventory. • Service objectives • Setting stocking levels so that there is only a specified probability of running out of stock • Cost objectives • Balancing conflicting costs to find the most economical replenishment quantities and timing CR (2004) Prentice Hall, Inc.
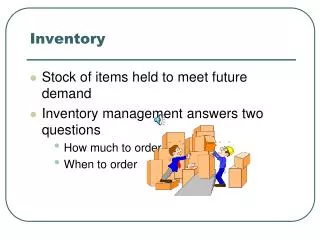
4 3 Inventory Management Answers Four Important Questions • How to order? • When to order? • What to order? • How much to order?
Why Hold Inventory? 2 4 • It enables the firm to achieve economies of scale • It balances supply and demand • It enables specialization in manufacturing • It provides protection from uncertainties in demand and order cycle • It acts as a buffer between critical interfaces within the channel of distribution
Economies of Scale • Inventory is required if an organization is to realize economies of scale in purchasing, transportation, or manufacturing. • Per unit price reductions! • The cost of maintaining this inventory must be “traded off” against the production savings realized.
Balancing Supply and Demand • Seasonal supply or demand may make it necessary for a firm to hold inventory. (finished goods) • Demand for a product may be relatively stable throughout the year, but raw materials may be available only at certain times during the year. • Ex: Canned fruits and vegetables
Specialization • Inventory makes it possible for each of a firm’s plants to specialize in the products that it manufactures. • The finished products can be shipped to field warehouses where they are mixed to fill customer orders. • Whirlpool Co.- cost savings through specializing manufacturing by plant location and the consolidation of warehouse operations • Focused Factories-specialization by facility
Protection From Uncertainties • Inventory is held as protection from uncertainties; that is, to prevent a stock out in the case of variability in demand or variability in the replenishment cycle. • Inventory planning is critical to successful manufacturing operations to protect from uncertainties.
Inventory As A Buffer • Inventory is held throughout the supply chain to act as a buffer for the following critical interfaces: • * supplier-procurement • * procurement-production • * production-marketing • * marketing-distribution • * distribution-intermediary • * intermediary-customer/user
TYPES OF INVENTORIES Inventories can be classified based on the reasons for which they are accumulated. • In-transit inventories • Speculative stock • Seasonal stock • Dead stock • Cycle stock • Safety or buffer stock
In-transit Inventories • In-transit inventories are items that are en route from one location to another • For calculating inventory carrying costs,in-transit inventory should be considered as inventory at the place of shipment origin since the items are not available for use, sale ,etc.
Speculative Stock • Speculative stock is inventory held for reasons other than satisfying current demand • Materials may be purchased in volumes larger than necessary: • to receive quantity discounts, • because of a forecasted price increase • materials shortage, • to protect against the possibility of a strike.
Seasonal Stock • Seasonal stock is a form of speculative stock that involves the accumulation of inventory before a seasonal period begins • This often occurs with agricultural products and seasonal items. • Ex: back-to-school
Dead Stock • Dead stock refers to items for which no demand has been registered for some specified period of time. • Dead stock might be obsolete throughout a company or only at one stock keeping (SKU) location. • J.C. Whitney Company-sells auto parts that are no longer produced • Transshipment of dead stock-Asia markets
Cycle Stock • Cycle stock is inventory that results from replenishment of inventory sold or used in production. • It is required in order to meet demand under conditions of certainty; that is, when the firm can predict demand and replenishment times (lead times). • Orders are scheduled to arrive just as the last unit is sold-no extra inventory beyond the cycle stock is required.
Cycle Stock Lot or batch size: The quantity that a stage of supply chain either produces or purchases at a given time • Q: quantity in a lot or batch size • Cycle stock: Q / 2
Safety or Buffer Stock • Safety or buffer stock is held in excess of cycle stock because of uncertainty in demand or lead time. • Average inventory at a stock keeping location that experiences demand or lead time variability= half the order quantity (cycle stock)+ the safety stock
The Effect of Reorder Quantity on Average Inventory Investment with Constant Demand and Lead Time 4 4 A . O r d e r q u a n t i t y o f 4 0 0 u n i t s I n v e n t o r y O r d e r O r d e r a r r i v a l a r r i v a l 4 0 0 O r d e r O r d e r A v e r a g e p l a c e d p l a c e d c y c l e i n v e n t o r y 2 0 0 0 1 0 2 0 3 0 4 0 5 0 6 0 D a y s Demand:20 units
The Effect of Reorder Quantity on Average Inventory Investment with Constant Demand and Lead Time 4 5 B . O r d e r q u a n t i t y o f 2 0 0 u n i t s I n v e n t o r y A v e r a g e O r d e r O r d e r c c l e 2 0 0 a r r i v a l p l a c e d i n v e n t o r y y 1 0 0 0 1 0 2 0 3 0 4 0 5 0 6 0 D a y s Demand:20 units
The Effect of Reorder Quantity on Average Inventory Investment with Constant Demand and Lead Time 4 6 C . O r d e r q u a n t i t y o f 6 0 0 u n i t s I n v e n t o r y 6 0 0 O r d e r a r r i v a l A v e r a g e O r d e r c y c l e p l a c e d i n v e n t o r y 3 0 0 0 1 0 2 0 3 0 4 0 5 0 6 0 D a y s Demand:20 units
Average Inventory Investment Under Conditions of Uncertainty A . W i t h v a r i a b l e d e m a n d I n v e n t o r y 2 0 0 A v e r a g e c y c l e i n v e n t o r y { 1 0 0 A v e r a g e { i n v e n t o r y 8 1 0 2 0 3 0 4 0 S a f e t y ( 1 5 0 ) s t o c k D a y s ( 5 0 ) 11 4 Demand:2025 units
Average Inventory Investment Under Conditions of Uncertainty B . W i t h v a r i a b l e l e a d t i m e I n v e n t o r y 2 0 0 A v e r a g e c y c l e i n v e n t o r y { 1 0 0 A v e r a g e { i n v e n t o r y 10 1 2 2 0 3 0 4 0 S a f e t y ( 1 4 0 ) s t o c k D a y s ( 4 0 ) 12 4 If orders arrive 2 days late
Average Inventory Investment Under Conditions of Uncertainty 13 4 C . W i t h v a r i a b l e d e m a n d a n d l e a d t i m e I n v e n t o r y 2 0 0 A v e r a g e c y c l e i n v e n t o r y { 1 0 0 A v e r a g e { i n v e n t o r y 8 10 1 2 2 0 3 0 4 0 ( 2 0 0 ) S a f e t y s t o c k D a y s ( 1 0 0 )
Factors Influencing Safety Stocks 14 4 • Forecast error • Exposure to stockout • Lead time • Service level requirement
Impact of Demand Patterns on Inventory Management • Just-in-time (production philosophy) • Attempts to synchronize stock flows so as to just meet demand as it occurs • Minimizes the need for inventory • INDEPENDENT versus DEPENDENT DEMAND • Whether the demand for an item depends on demand for something else-dependent demand • - demand for an item depends on demand for something else
Pull strategy • production and distribution are demand driven so that they are coordinated with actual customer orders, rather than forecasted demand. • Draws inventory into the stocking location • Each stocking location is considered independent • Maximizes local control of inventories
Push Strategy • Products are pushed through the channel, from the production side up to the retailer. • The manufacturer sets production at a level in accord with historical ordering patterns of retailers. • It takes longer for a push-based supply chain to respond to changes in demand, which can result in overstocking or bottlenecks and delays (the bullwhip effect), unacceptable service levels and product obsolescence. • - Allocates production to stocking locations based on overall demand • - Encourages economies of scale in production
Push-Pull Boundary • the interface between the push-based stages and the pull-based stages is known as the push-pull boundary. • Dell- Inventory levels of individual components are determined by forecasting general demand, but final assembly is in response to a specific customer request. The push-pull boundary would then be at the beginning of the assembly line.
Inventory Carrying Cost • Inventory carrying costs are those costs associated with the amount of inventory stored. • Inventory carrying costs are made up of a number of different costs. • Unfortunately, many companies have never calculated inventory carrying costs, even though these costs are both real and substantial. • Benchmarking the percentage of inventory carrying costs-Avon /Revlon
Normative Model of Inventory Carrying Cost Methodology 5 3 Capitalcosts Inventory Investment Insurance Inventoryservicecosts Taxes Inventory Carrying Costs Plant warehouses Public warehouses Storagespace costs Rented warehouses Company-owned warehouses Obsolescence Damage Inventoryrisk costs Pilferage Relocation costs
MAIN AIMS OF INVENTORY MANAGEMENT • To improve cash flows • To improve return on investment (ROI)
Inventory and Least Total Cost Logistics Inventory carrying cost is related with the decision of • logistics system design, • customer service levels, • number and location of DCs, • transportation modes, • inventory levels • production schedules.
Inventory turnover as a Measure Of Inventory Management Effectiveness Inventory turnover= Total cost of goods sold /Average inventory at cost Average inventory at cost = beginning inventory (cost) + ending inventory (cost) / 2 Inventory Turns (Inventory Turnover): The number of times that a company’s inventory cycles or turns over per year. It is one of the most commonly used Supply Chain Metrics showing how fast a company is selling through its inventory and efficiently managing its resources
The Impact of Inventory Turns on Inventory Carrying Costs 5 8 Inventory Average Carrying Cost Carrying Cost Turns Inventory at 40 Percent Savings 1 $750,000 $300,000 - 2 375,000 150,000 $150,000 3 250,000 100,000 50,000 4 187,500 75,000 25,000 5 150,000 60,000 15,000 6 125,000 50,000 10,000 7 107,143 42,857 7,143 8 93,750 37,500 5,357 9 83,333 33,333 4,167 10 75,000 30,000 3,333 11 68,182 27,273 2,727 12 62,500 25,000 2,273 13 57,692 23,077 1,923 14 53,571 21,428 1,649 15 50,000 20,000 1,428
Relationship between Inventory Turns and Inventory Carrying Costs 5 9 Inventory carrying costs $ 3 0 0 , 0 0 0 $ 2 7 5 , 0 0 0 $ 2 5 0 , 0 0 0 $ 2 2 5 , 0 0 0 $ 2 0 0 , 0 0 0 $ 1 7 5 , 0 0 0 $ 1 5 0 , 0 0 0 $ 1 2 5 , 0 0 0 $ 1 0 0 , 0 0 0 $ 7 5 , 0 0 0 $ 5 0 , 0 0 0 $ 3 7 5 0 0 , $ 2 5 , 0 0 0 0 1 2 3 4 5 6 7 8 9 1 0 1 1 1 2 1 3 1 4 1 5 Inventory Turns
Annual Inventory Carrying Costs Compared to Inventory Turnovers 10 5 Inventory carrying costs (per unit) $30.00 Variable Manufacturing Cost $100 Carrying Cost % x 30% Annual Cost to Carry in Inventory $30 Monthly Cost (1/12) $2.50 15.00 12.50 10.00 7.50 6.00 5.00 3.75 2.50 0 1 2 3 4 5 6 7 8 9 1 0 1 1 1 2 Inventory Turns
ABC Analysis-Pareto • 80/20 concept is useful in distribution and inventory management. • The top 20 %-A ~ wide geographic distribution through many warehouses with high levels of stock availability • The next 30 %- B • The remainder 50 %- C~distributed from a single, central stocking point
The EOQ Model 4 7 2 P D E O Q = C V where: P = The ordering cost (dollars per order) D = Annual demand or usage of the product (number of units) C = Annual inventory carrying cost (as a percentage of product cost or value) V = Average cost or value of one unit of inventory
Cost Trade-offs Required to Determine the Most Economic Order Quantity 4 8 Total cost Annual cost (dollars) L o w e s t t o t a l c o s t ( E O Q ) Inventory carrying cost Ordering cost Size of order
Cost Trade-offs Required to Determine the Most Economic Order Quantity 4 9 Inventory Carrying Number Ordering Total Cost of Orders Cost Order Cost 1/2 Q X C X V (D/Q) PX (D/Q) Quantity 40 120 $ 4,800 $ 500 $ 5,300 60 80 3,200 750 3,950 80 60 2,400 1,000 3,400 100 48 1,920 1,250 3,170 120 40 1,600 1,500 3,100 140 35 1,400 1,750 3,150 160 30 1,200 2,000 3,200 200 24 960 2,500 4,460 300 18 720 3,750 4,470 400 12 480 5,000 5,480
Assumptions of the Simple EOQ Model • A continuous, constant, and known rate of demand. • A constant and known replenishment cycle or lead time. • A constant purchase price that is independent of the order quantity or time. • A constant transporation cost that is independent of the order quantity or time. • The satisfaction of all demand (no stockouts are permitted). • No inventory in transit. • Only one item in inventory, or at least no interaction among items. • An infinite planning horizon. • No limit on capital availability. 10 4
Symptoms of Poor Inventory Management • Increasing numbers of back orders. • Increasing investment in inventory with back orders remaining constant. • High customer turnover rate. • Increasing number of orders canceled. • Periodic lack of sufficient storage space. • Wide variance in turnover of major inventory items between distribution centers. • Deteriorating relationship with intermediaries, as typified by dealer cancellations and declining orders. • Large quantities of obsolete items.
Methods for Reducing Inventory • Multiechelon inventory planning.(ABC analysis) • Lead time analysis. • Delivery time analysis. • Elimination of low turnover and/or obsolete items. • Analysis of pack size and discount structure. • Examination of procedures for returned goods. • Encouragement/automation of product substitution. • Installation of formal reorder review systems. • Measurement of fill rates by storekeeping units.
Methods for Reducing Inventory (Cont’d) • Analysis of customer demand characteristics. • Development of a formal sales plan and emend forecast by predetermined logic. • Expand view of inventory to include inventory management and information sharing at various levels in the SC. • Reengineering inventory management practices to realize improvements in product flow.