Download
1 / 1
10 likes | 136 Views
36. 40. 29. 30. 23. 20. 12. 10. 0. Genetic. Prenatal. Perinatal. Childhood. Graph 3. Diagnosis classification (%). Characteristics of a paediatric UK based low vision population. Nana Theodorou BMedSci(Hons) PhD Tracey Shipman DBO(D) BSc(Hons).

E N D
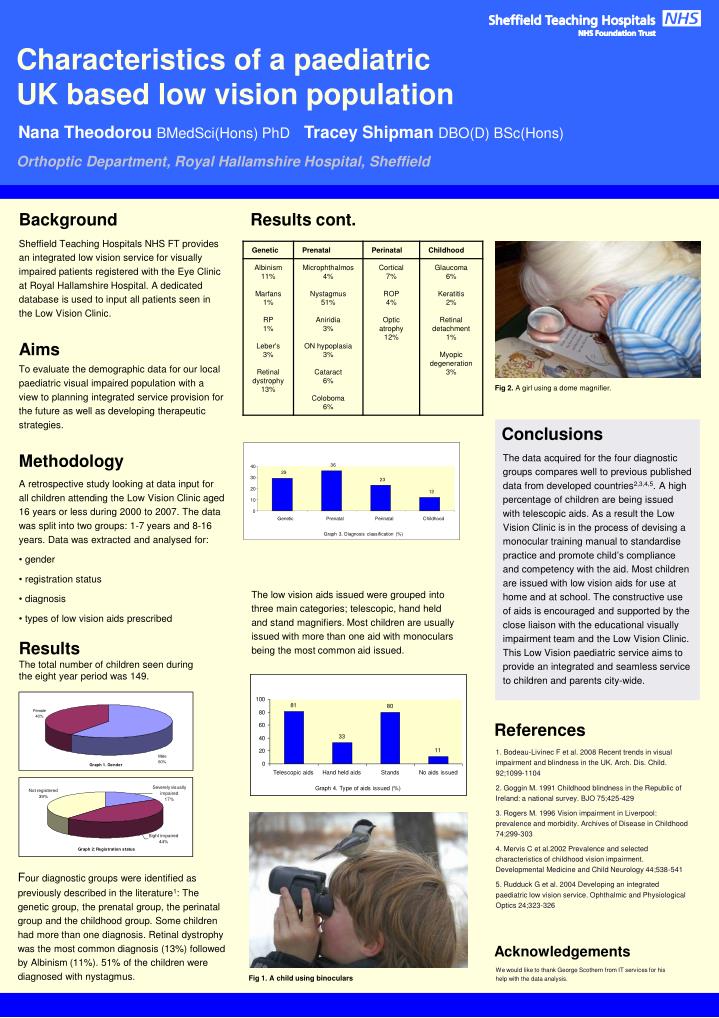
36 40 29 30 23 20 12 10 0 Genetic Prenatal Perinatal Childhood Graph 3. Diagnosis classification (%) Characteristics of a paediatric UK based low vision population Nana Theodorou BMedSci(Hons) PhD Tracey Shipman DBO(D) BSc(Hons) Orthoptic Department, Royal Hallamshire Hospital, Sheffield Background Results cont. Sheffield Teaching Hospitals NHS FT provides an integrated low vision service for visually impaired patients registered with the Eye Clinic at Royal Hallamshire Hospital. A dedicated database is used to input all patients seen in the Low Vision Clinic. Aims To evaluate the demographic data for our local paediatric visual impaired population with a view to planning integrated service provision for the future as well as developing therapeutic strategies. Fig 2. A girl using a dome magnifier. Conclusions Methodology The data acquired for the four diagnostic groups compares well to previous published data from developed countries2,3,4,5. A high percentage of children are being issued with telescopic aids. As a result the Low Vision Clinic is in the process of devising a monocular training manual to standardise practice and promote child’s compliance and competency with the aid. Most children are issued with low vision aids for use at home and at school. The constructive use of aids is encouraged and supported by the close liaison with the educational visually impairment team and the Low Vision Clinic. This Low Vision paediatric service aims to provide an integrated and seamless service to children and parents city-wide. • A retrospective study looking at data input for all children attending the Low Vision Clinic aged 16 years or less during 2000 to 2007. The data was split into two groups: 1-7 years and 8-16 years. Data was extracted and analysed for: • gender • registration status • diagnosis • types of low vision aids prescribed The low vision aids issued were grouped into three main categories; telescopic, hand held and stand magnifiers. Most children are usually issued with more than one aid with monoculars being the most common aid issued. Results The total number of children seen during the eight year period was 149. References 1. Bodeau-Livinec F et al. 2008 Recent trends in visual impairment and blindness in the UK. Arch. Dis. Child. 92;1099-1104 2. Goggin M. 1991 Childhood blindness in the Republic of Ireland: a national survey. BJO 75;425-429 3. Rogers M. 1996 Vision impairment in Liverpool: prevalence and morbidity. Archives of Disease in Childhood 74;299-303 4. Mervis C et al.2002 Prevalence and selected characteristics of childhood vision impairment. Developmental Medicine and Child Neurology 44;538-541 5. Rudduck G et al. 2004 Developing an integrated paediatric low vision service. Ophthalmic and Physiological Optics 24;323-326 Four diagnostic groups were identified as previously described in the literature1: The genetic group, the prenatal group, the perinatal group and the childhood group. Some children had more than one diagnosis. Retinal dystrophy was the most common diagnosis (13%) followed by Albinism (11%). 51% of the children were diagnosed with nystagmus. Acknowledgements We would like to thank George Scothern from IT services for his help with the data analysis. Fig 1. A child using binoculars