Download
1 / 56
560 likes | 713 Views
Overview of the health of Indigenous people in Western Australia 2013. Key facts, figures and tables. Indigenous population. At 30 June 2011, the estimated Western Australian Indigenous population was 88,277.

E N D
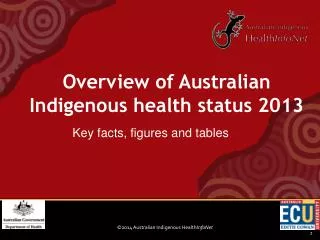
Overview of the health of Indigenous people in Western Australia 2013 Key facts, figures and tables
Indigenous population • At 30 June 2011, the estimated Western Australian Indigenous population was 88,277. • In 2011, around 96% of Indigenous people living in WA were Aboriginal, 1.9% were Torres Strait Islanders, and 1.9% of people identified as being of both Aboriginal and Torres Strait Islander descent. • The Indigenous population is much younger than the non-Indigenous population. • More than one-third (37%) of WA’s Indigenous population lived in the Perth metropolitan area, and 15% lived in the South-Western region.
Population pyramid of Indigenous and non-Indigenous populations in WA, 30 June 2011 Source: ABS, 2013
Place of usual residence for Western Australian Indigenous population by Indigenous region, 30 June 2011 • Source: ABS, 2013 • Notes: • This table presents raw census count numbers and as such underestimates the population of Indigenous people in each jurisdiction. For this reason the status unknown column is included • The Indigenous regions are those used by the ABS for aggregation of population estimates
Births and pregnancy outcome • In 2011, there were 2,506 births registered in WA with one or both parents identified as Indigenous (8% of all births registered). • In 2011, Indigenous mothers in WA were younger than non-Indigenous mothers; the median age was 24.2 years for Indigenous mothers and 30.3 years for all mothers. • In 2011, total fertility rates were 3,011 births per 1,000 for Indigenous women in WA and 1,953 per 1,000 for all women in WA.
In 2010, the average birthweight of babies born to Indigenous mothers living in WA was 3,139 grams compared with 3,353 grams for babies born to non-Indigenous mothers. • In 2010, the proportion of low birthweight babies born to Indigenous women in WA was twice that of non-Indigenous women (13.6% compared with 6.1%).
Age-specific fertility rates, by Indigenous status of mother, WA and Australia, 2011 • Source: ABS, 2012 • Notes: • Rates are births per 1,000 women in each age-group • n.p. refers to numbers not available for publication, but included in totals where applicable • Births to mothers aged less than 15 years are included in the 15-19 years age-group • Births to mothers aged 50 years or older are included in the 45-49 years age-group
Indigenous mortality • In 2006-2010, the age-standardised death rate for Indigenous people in WA was 2.5 times the rate for non-Indigenous people. • Between 1991 and 2010, there was a 35% reduction in the death rates for Indigenous people in WA. • For Indigenous people born 2005-2007 in WA, life expectancy was estimated to be 65.0 years for males and 70.4 years for females, around 14 and 12.5 years less than the estimates for non-Indigenous males and females, respectively.
In 2007-2011, age-specific death rates were higher for Indigenous people than for non-Indigenous people across all age-groups in WA, and were much higher in the middle adult years. • For 2009-2011, the infant mortality rate was 2.4 times higher for Indigenous infants than that for non-Indigenous infants in WA. • For 2006 to 2010, the leading causes of death among Indigenous people in WA were cardiovascular disease, injury, and neoplasms (almost entirely cancers). • In 2006-2010, the age-adjusted rate of avoidable deaths for Indigenous people was 4.8 times higher than the rate for non-Indigenous people in WA.
Age-specific death rates, by sex and Indigenous status, and Indigenous:non-Indigenous rate ratios, WA, 2007-2011 • Source: ABS, 2012 • Notes: • Rates are per 100,000 population, except for age 0 • Rate ratio is the Indigenous rate divided by the non-Indigenous rate • Deaths for which Indigenous status was not stated were excluded from the calculation of rates
Age-standardised death rates, by Indigenous status and cause, and Indigenous:non-Indigenous rate ratios, WA, 2006-2010 • Source: AIHW, 2013 • Notes: • Due to the under-identification of Indigenous deaths, these rates are likely to under-estimate the true difference between the Indigenous and non-Indigenous populations • Rates per 100,000 population • Ratio is the Indigenous rate divided by the non-Indigenous rate
Indigenous hospitalisation • In 2010-11, 7.4% of all hospitalisations in WA were of Indigenous people. • In 2010-11, the age-standardised hospital separation rate for Indigenous people in WA was 3.8 times higher than that for other Western Australians. • In 2010-11, the main causes of hospitalisation for Indigenous people were for ‘care involving dialysis’ and injury.
Age-specific hospital separation rates (excluding dialysis), by Indigenous status and sex, and Indigenous:non-Indigenous rate ratios, WA, 2008-10 • Source: AIHW, 2013 • Notes: • Numbers include separations for which Indigenous status was not stated • Rates are expressed as separations per 1,000 population • Rate ratio is the Indigenous rate divided by the non-Indigenous rate • Rate ratios for ‘All ages’ are directly age-standardised using the 2001 Australian standard population (*)
Age-standardised hospital separation rates, by principal diagnosis and Indigenous status, and Indigenous:non-Indigenous rate ratios, WA, 2008-10 • Source: Derived from AIHW, 2013 • Notes: • Numbers include separations for which Indigenous status was not stated • Rates are expressed as separations per 1,000 population and directly age-standardised using the 2001 Australian standard population • Rate ratio is the Indigenous rate divided by the non-Indigenous rate
Cardiovascular disease • In 2004-2005, 11% of Indigenous people in WA reported having a long-term heart or related condition. • In 2008-10, Indigenous people in WA were hospitalised for cardiovascular diseases at 1.9 times the rate of non-Indigenous people. • In 2006-2010, cardiovascular disease was the leading cause of death for Indigenous people in WA, accounting for 26% of Indigenous deaths. • In 2006-2010, the age-adjusted death rate for Indigenous people was 2.3 times the rate for non-Indigenous people in WA.
Age-specific hospitalisation rates for cardiovascular disease, by sex and Indigenous status, and Indigenous:non-Indigenous rate ratios, WA, 2008-10 • Source: AIHW, 2013 • Notes: • Rates per 1,000 population • Rate ratio is the Indigenous rate divided by the non-Indigenous rate • Rate ratios for ‘All ages’ have been directly age-standardised using the 2001 Australian standard population (*)
Age-standardisedhospitalisation rates for Indigenous people for a principal diagnosis of disease of the circulatory system, by type of circulatory disease, and Indigenous:non-Indigenous rate ratios, WA, 2008-10 • Source: AIHW, 2013 • Notes: • 1. Rates are per 1,000 population, directly age standardised using the Australian 2001 standard population • Rate ratio is Indigenous rate divided by the non-Indigenous rate
Cancer • In 2007-2011, age-adjusted cancer incidence rates were similar for Indigenous people and non-Indigenous people in WA. • In 2007-2011, the most common cancers diagnosed among Indigenous people in WA were lung and breast cancer. • In 2008-10, age-standardisedhospitalisation rates for cancer were lower for Indigenous people than those for non-Indigenous people in WA. • In 2006-2010, the age-standardised death rate for all cancers for Indigenous people was 1.5 times higher than that for non-Indigenous people in WA.
Age-standardised incidence rates for selected cancers, by Indigenous status and sex, and Indigenous:non-Indigenous rate ratios, WA, 2007-2011 • Source: Western Australian Cancer Registry, 2013 • Notes: • Rates are per 100,000 population • Ratio is the Indigenous rate divided by the non-Indigenous rate
Age-specific incidence rates for cancer, by sex and Indigenous status, and Indigenous:non-Indigenous rate ratios, WA, 2007-2011 • Source: Western Australian Cancer Registry, 2013 • Notes: • Rates are per 100,000 population • Ratio is the Indigenous rate divided by the non-Indigenous rate • n.p. refers to numbers not available for publication
Age-specific hospitalisation rates for cancer, by Indigenous status, and Indigenous:non-Indigenous rate ratios, WA, 2008-2010 • Source: AIHW, 2013 • Notes: • Ratio is the Indigenous rate divided by the non-Indigenous rate
Age-standardised cancer death rates, by Indigenous status and type of cancer, and Indigenous:non-Indigenous rate ratios, WA, 2006-2010 • Source: AIHW, 2013 • Notes: • Rates are per 100,000 population • Ratio is the Indigenous rate divided by the non-Indigenous rate • Rates are directly age-standardised using the 2001 Australian estimated resident population • Cervical cancer is for females only
Diabetes • In 2004-2005, 8.8% of Indigenous people in WA reported having diabetes; after age-adjustment, Indigenous people were 3.7 times more likely to report having some form of diabetes than were non-Indigenous people. • In 2008-10, age-adjusted hospitalisation rates for diabetes for Indigenous males and females were 4.4 and 6.2 times the rates of other males and females in WA, respectively. • In 2006-2010, Indigenous people in WA died from diabetes at 8.7 times the rate of non-Indigenous people.
Age-specific hospitalisation rates for a principal diagnosis of diabetes, by Indigenous status, and Indigenous:non-Indigenous rate ratios, WA, 2008-10 • Source: AIHW, 2013 • Notes: • Ratio is the Indigenous rate divided by the non-Indigenous rate • Rate ratio for ‘All ages’ are directly age-standardised using the 2001 Australian standard population (*)
Social and emotional wellbeing • In 2008, Indigenous people in WA experienced high to very high levels of psychological distress at almost three times the rate reported by non-Indigenous people. • In 2008, 92% of Indigenous people living in WA felt happy either some, most, or all of the time. • In 2000-2001, 24% of WA Indigenous children aged 4-17 years were at high risk of clinically significant emotional or behavioural difficulties; this compares with 15% of similarly aged children in the State’s general population.
In 2008-10, after age-adjustment, the hospitalisation rate for Indigenous males and females in WA with mental health-related conditions was 3.1 and 2.1 times the rates for their non-Indigenous counterparts, respectively. • In 2005-2009, the death rate for ICD ‘Intentional self-harm’ for Indigenous people living in WA was 3.1 times the rate for non-Indigenous people.
Kidney health • In 2008-2010, after age-adjustment, the notification rate of end stage renal disease was 11.7 times higher for Indigenous people than that for non-Indigenous people in WA. • In 2008-10, the age-adjusted hospitalisation rate for dialysis and chronic kidney disease were 15 times higher for Indigenous people than that non-Indigenous people living in WA. • In 2006-2010, the age-standardised death rate from kidney disease was 5.4 times higher for Indigenous people than that for non-Indigenous people in WA.
Numbers and age-standardised incidence rates of end stage kidney disease, by Indigenous status, and Indigenous:non-Indigenous rate ratios, WA and Australia, 2008-2010 • Source: AIHW, 2013 • Notes: • Rates per 100,000 population • Rate ratio is the Indigenous rate divided by the non-Indigenous rate
Age-specific notification rates of end-stage kidney disease, by Indigenous status, and Indigenous:non-Indigenous rate ratios, WA and Australia, 2008-2010 • Source: AIHW, 2013 • Notes: • Rates per 100,000 population • Ratio is the Indigenous rate divided by the non-Indigenous rate • Rates and rat ratios for ‘All ages’ are age standardised
Age-standardisedhospitalisation rates for dialysis and chronic kidney disease, by Indigenous status and sex, WA and NSW, Vic, Qld, WA, SA and NT combined, 2008-10 • Source: AIHW, 2013 • Notes: • 1. Rates per 1,000 population • Ratio is the Indigenous rate divided by the non-Indigenous rate • Rates were directly age-standardised using the 2001 Australian standard population
Injury • In 2008-10, after age-adjustment, Indigenous people were hospitalised for injury at 2.9 times the rate for non-Indigenous people in WA. • In 2006-2010, injury was the second most common cause of death among Indigenous people in WA, accounting for 18% of Indigenous deaths.
Numbers and proportions of injury-related hospital separations, and age-standardised Indigenous rates, by principal diagnosis, and Indigenous:non-Indigenous rate ratios, WA, 2008-10 • Source: AIHW, 2013 • Notes: • Rate per 1,000 population directly age-standardised using the 2001 Australian standard population • Ratio is the Indigenous rate divided by the non-Indigenous rate
Respiratory disease • In 2004-2005, the overall levels of respiratory disease were similar for Indigenous and non-Indigenous people in WA. • In 2008-10, the age-standardisedhospitalisation rate for respiratory disease was 4.0 times higher for Indigenous people than that for non-Indigenous people in WA. • In 2006-2010, after age-adjustment, the death rate for Indigenous people was 2.9 times higher than that for non-Indigenous people in WA.
Age-specific hospitalisation rates for respiratory diseases, by sex and Indigenous status, and Indigenous:non-Indigenous rate ratios, WA, 2008-10 • Source: AIHW, 2013 • Notes: • Rates are per 1,000 population • Rates for ‘All ages’ are directly age-standardised using the Australian 2001 standard population • Rate ratios for ‘All ages’ are directly age-standardised using the 2001 Australian standard population (*)
Eye health • In 2004-2005, eye and sight problems were reported by 29% of Indigenous people in WA. • In 2008, WA was the jurisdiction with the highest prevalence of low vision among Indigenous adults (12%) and the second highest prevalence among Indigenous children (1.9%). • In 2008-10, hospitalisation rates for diseases of the eye and adnexa were lower for Indigenous people than those for non-Indigenous people in WA.
Ear health • In 2008, 9.0% of Indigenous children in WA aged 0-14 years had ear/hearing problems. • In 2004-2005, prevalence of diseases of the ear and mastoid was higher among Indigenous children living in remote areas of WA (16% males and 12% females) than among those living in non-remote areas (9% males and 7% females). • In 2008-10, the age-adjusted hospitalisation rate for Indigenous people for disease of the ear and mastoid process was 1.5 times higher than the non-Indigenous rate in WA.
Oral health • In 2008, 28% of Indigenous children in WA had problems with their teeth or gums. • In 2004-2005, 77% of Indigenous adults in WA had lost fewer than five adult teeth.
Proportions (%) of Indigenous people reporting number of lost teeth and denture use, by age-group and type of condition, WA, 2004-2005 • Source: ABS, 2006 • Notes: • Some proportions should be viewed with caution because of sampling variability • n.p. refers to numbers not available for publication, but included in totals where applicable
Disability • In 2011, after age-adjustment, Indigenous people were more than twice as likely as non-Indigenous people in WA to have a profound/core activity restriction.
Age-standardised prevalence (%) of adults with a disability, non-remote areas, by Indigenous status, WA and Australia, 2008 • Source: Derived from AIHW, 2013 • Notes: • Proportions are age-standardised • Caution should be exercised in comparing these estimates with those from other sources because these estimates (a) are restricted to people living in non-remote areas; and (b) being age-standardised, are not directly comparable with the actual prevalences • Ratio is the Indigenous rate divided by the non-Indigenous rate
Prevalence (%) of people needing assistance with core activities, by sex, Indigenous status, and age-group, WA, 2011 • Source: Derived from ABS, 2013, ABS, 2001 • Notes: • Prevalences are expressed as percentages • Ratio is the Indigenous proportion divided by the non-Indigenous proportion • Rate ratios for 'All ages' are age-standardised using the 2001 Australian standard population (*) 4. The information in this table is based on counts from the 2011 Census
Proportions (%) of ‘potential’ users accessing NDA specialist disability support services, by Indigenous status and type of service, WA, 2010-11 • Source: Steering Committee for the Review of Government Service Provision, 2013 • Notes: • ‘Potential’ users are people aged 0-64 years with the ‘potential to require disability support services, including individuals who meet the service eligibility criteria but who do not demand these services’ • Ratio is the Indigenous rate divided by the non-Indigenous rate
Communicable diseases • In 2009-2011, the age-standardised rate for hepatitis B notifications for Indigenous people in WA was almost three times, and the rate for hepatitis C notifications was four times, the rates reported for other people in WA. • In 1997-2007, the age-adjusted notification rate of invasive pneumococcal disease was 6.7 times higher for Indigenous people than that for non-Indigenous people in WA. • In 2011, the age-adjusted notification rate for gonorrhoea for Indigenous people living in WA was 44 times higher than the rate for non-Indigenous people.
In 2011, the age-adjusted notification rate for infectious syphilis for Indigenous people living in WA was 11 times the rate for non-Indigenous people. • In 2011, the age-adjusted notification rate for chlamydia for Indigenous people living in WA was almost four times higher than the rate for non-Indigenous people. • In 2011, there were 98 cases of newly diagnosed HIV infection in WA, of which five were identified as Indigenous.
Proportions (%) of invasive pneumococcal disease notifications among Indigenous people, by age-group and sex, WA, 2007-2011 Source: Western Australian Department of Health, 2013
Nutrition • In 2004-2005, the majority of Indigenous people in WA reported eating fruit (85%) and vegetables (94%) on a daily basis.
Physical activity • In 2008, 29% of Indigenous adults and 66% of Indigenous children living in WA took part in some type of physical activity or sport in the previous 12 months. • In 2004-2005, 71% of Indigenous adults in non-remote areas of WA reported sedentary or low levels of activity.
Bodyweight • In 2004-2005, the age-adjusted level of obesity/overweight was 1.3 times higher for Indigenous adults than that for non-Indigenous adults in WA.
Proportions (%) of overweight or obese adults, by Indigenous status and age-group, and Indigenous:non-Indigenous rate ratios, WA and Australia, 2004-2005 Source: AIHW, 2013 Note Proportions are age-standardised
Weight status of adults, by Indigenous status and weight classification, WA, 2004-2005 Source: AIHW, 2013