Download
1 / 20
200 likes | 326 Views
Find the solutions. Find the Vertex and Max. (-1, 0) (5, 0). (2, 10). Find the following 3. Domain: 4. Range: 5. Zeros: 6. y-intercepts:. All reals. All reals. (-2, 0) (1, 0). (0, -4). Find the following: 7. Domain and Range: 8. Zeros and y intercept: 9. Min.

E N D
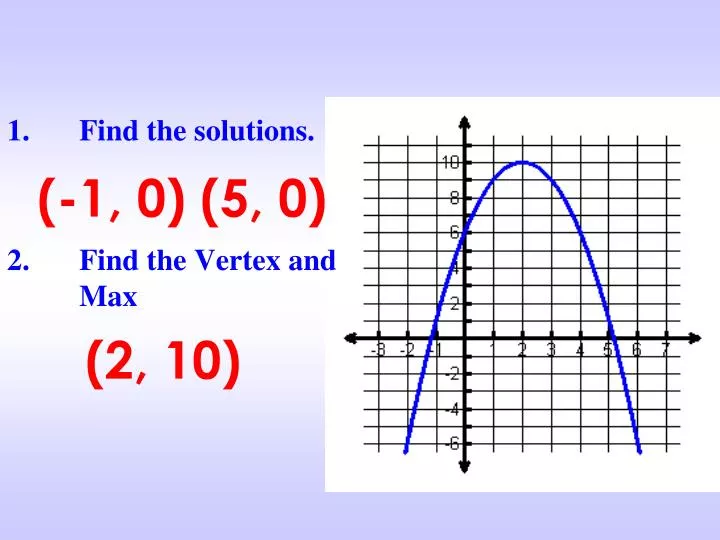
Find the solutions. • Find the Vertex and Max (-1, 0) (5, 0) (2, 10)
Find the following 3. Domain: 4. Range: 5. Zeros: 6. y-intercepts: All reals All reals (-2, 0) (1, 0) (0, -4)
Find the following: 7. Domain and Range: 8. Zeros and y intercept: 9. Min
Domain and Range: Graph Look horizontally: What x-values are contained in the graph? That’s your domain! Look vertically: What y-values are contained in the graph? That’s your range!
Domain and Range: Graph (-4,-3)
Maximum and Minimum Maximum value: the highest y value seen in the data or on the graph. Minimum value: the lowest y value seen in the data or on the graph.
Increasing and Decreasing: Graph To find where the graph is increasing and decreasing trace the graph with your finger from left to right. Specify x-values! If your finger is going up, the graph is increasing. If your finger is going down, the graph is decreasing.
End Behavior: Graph The value a function, f(x), approaches when x is extremely large (∞) or when x is extremely small (-∞).
End Behavior -∞ ∞
Average Rate of Change • The average range of changebetween any two points (x1,f(x1)) and (x2,f(x2)) is the SLOPE of the line through the 2 points.
Example 1 • Find the average rate of change of f(x) = x3 – 3x when x1= -2 and x2 = 0.