Download
1 / 20
200 likes | 381 Views
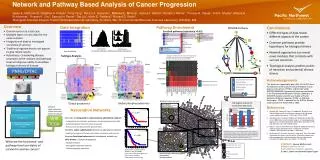
Discovery of Cell Function Pathway Associations Based on Neural Network and Random Forest Models. Presented By Melanie Smith. Bioengineering and Bioinformatics Summer Institute Massey Cancer Research Lab Virginia Commonwealth University. Project Overview. Question: How Do Pathways Relate?

E N D
Discovery of Cell Function Pathway Associations Based on Neural Networkand Random Forest Models Presented By Melanie Smith Bioengineering and Bioinformatics Summer Institute Massey Cancer Research Lab Virginia Commonwealth University
Project Overview • Question: How Do Pathways Relate? • Approach: • 60 Human Cell Lines • Microarrays • Gene Expression Clusters • Computer Modeling • Pathway Mapping
Introduction • 60 Human Cell Lines • From National Cancer Institute • Tumor Cell Lines • Melanoma • Ovary • Kidney • Prostate • Breast • Leukemia • Lung • Colon • Central Nervous System
Developmental Therapeutics Program • Lines Used for Anticancer Drug Screening • Over 100,000 compounds tested • Molecular Targets • Gene Mutations • mRNA Levels • Protein Levels • Enzyme Activities • Target Information • Function • Sequence • Disease Associations • Goal: Identify Compounds Effective Against Cells with a Certain Molecular Profile
Previous Studies • Categorize Cancer Types Based on Microarray Data • D. T. Ross et al. (2000). Systematic variation in gene expression patterns in human cancer cell lines. Nature Genetics. 2000 March, 24 (3): 225-234. • Categorize Genes Based on Function • Ko, Daijin, Wanyan Xu, and Brad Windle. 2005. Gene function classification using NCI-60 cell line gene expression profiles. Computational biology and chemistry. 29:412-419.
Current Study • Link Gene Function Categories • Neural Network Model • 367 Training Genes: Represent 21 Pathways • 6,165 genes • 21 Pathways • Random Forest Model • 367 Training Genes: Represent 21 Pathways • 367 genes • 21 Pathways
21 Pathways From Kyoto Encyclopedia of Genes and Genomes • Genetic Information Processing • Ribosome • Polymerases • tRNA • Proteasome • Cellular Processes • Cell Cycle • Apoptosis • Cell Adhesion • Environmental Information Processing • MAP Kinase • PI Kinase • Human Diseases • Huntington’s Disease • Metabolism • Arginine and Proline • N-glycans • Glycolysis • Oxidative Phosphorylation • TCA Cycle • Pyrimidine • Glutathione • Valine, Leucine, Isoleucine • Porphyrin • Purine • Glycerolipids
Methods • Neural Network Model • Determines the Relative Probability that a Gene Exists in a Pathway • Random Forest Model • Each Gene Classified Into One Pathway • Repeated 500 Times • Repetition Iterated 100 Times • Multiple Trials Converted to Relative Probabilities
Methods • The Pathway with the Highest Probability is the Primary Function of the Gene • Secondary Function = 2nd Highest Probability…etc • Analyzed Data in Microsoft Excel • Wrote Programs as Macros Using Microsoft Visual Basic
Methods • For Every Primary Pathway • Found What Secondary Pathways the Genes were Classified to • Then Tertiary and Quaternary • Each Primary/Secondary Association was Assigned a Relative Probability • P-values were Determined Using Binomial Distribution
Methods • Pathways with Significant P-values were Mapped • Neural Network and Random Forest Pathway Maps were Compared • Pathways that were Associated in Both Models were Considered More Significant • Pathway Associations Apparent in Primary/Secondary, Primary/Tertiary, and/or Primary/Quaternary were More Significant • Scientific Literature Searched to Confirm Pathway Connections
Methods • Database Built Using FileMaker Developer 7.0 • Stores Information • Genes Used • GenBank ID • Short Description • Probability Numbers • Pathway Association Scores • Primary vs. Secondary etc.
Results PI Kinase Huntington's Disease Arginine and Proline Cell Cycle Apoptosis N-glycans Proteasome Polymerases
Results Valine, Leucine, and Isoleucine Glycolysis Glycerolipids PI Kinase Purine Cell Cycle Huntington's Disease
Results Ribosome TCA Cycle tRNA Oxidative Phosphorylation Glycolysis
Conclusions • Reaching a Better Understanding of • The Network of Functions that Make a Cell • The Side Effects of Drugs
More Research • Evolutionary Mechanism that lead to Pathway Associations • Regulatory Genes • Motifs • Experimental Confirmation of Pathway Associations • Trying More Genes and More Organisms
Acknowledgements • Dr. Brad Windle – BBSI Mentor • Dr. Jeff Elhai – BBSI Director • Dr. Richard Kliman – Home Mentor • BBSI
References • Ko, Daijin, Wanyan Xu, and Brad Windle. 2005. Gene function classification using NCI-60 cell line gene expression profiles. Computational biology and chemistry. 29:412-419. • Kyoto encyclopedia of genes and genomes. (2006). http://www.genome.ad.jp/kegg/.(8 June 2006). • Collins, Jerry M. Ph.D., Associate Director.Developmental Therapeutics Program NCI / NIH. (2006). http://dtp.nci.nih.gov./index.html. (4 Aug 2006). • D. T. Ross et al. (2000). Systematic variation in gene expression patterns in human cancer cell lines. Nature Genetics. 2000 March, 24 (3): 225-234.