Download
1 / 88
910 likes | 1.73k Views
The Relationships of Arsenic Exposure from Drinking Water with the Risks of As-related Skin Lesions and High Blood Pressure in Bangladesh Yu Chen, PhD, MPH. Background. Early / Intermediate Arsenicosis -Skin lesions -Respiratory lesions -Edema -Neurological symptoms

E N D
The Relationships of Arsenic Exposure from Drinking Water with the Risks of As-related Skin Lesions and High Blood Pressure in BangladeshYu Chen, PhD, MPH
Early / Intermediate Arsenicosis -Skin lesions -Respiratory lesions -Edema -Neurological symptoms Others -Reproductive outcomes -Children’s cognitive function Late Cancer -Skin -Bladder -Lung -Liver / Spleen Neuro-vascular/Endocrine -Hypertension -Stroke -Black-foot disease -Neuropathy -Diabetes mellitus Health Effects of Chronic Arsenic Exposure from Drinking Water
Maximum Admissible Concentration (MAC) of Arsenic in Drinking Water by Countries
Location of Health Effects of Arsenic Longitudinal Study (HEALS) Study Area . Araihazar
Health Effects of Arsenic Longitudinal Study (HEALS) • Source population created by well surveys • Well owners were interviewed to create a roster of all users of the tube wells (n=65,876) • Population-based sampling (7/2000-11/2001) • Eligibility criteria: 1) married, aged 18-65 years, 2) 5 years residency in the study area, and 3) users of one of the existing study tube wells for 3+ years. • 11,746 participants; 97.5% response rate (12,050 approached) • Demographics, lifestyle factors, water dinking patterns • A FFQ was administered and completed for 11,395 subjects. • Biological samples • Physical examination Ahsan et al, J Expo Anal Environ Epidemiol. 2005
Population Survey 66,000 People Descriptive Studies 12,000 Cohort Members Cross-sectional, Case-control Studies Baseline Data Interview Clinical Examination Tube-Well Water, Blood & Urine Randomized Clinical Trial Community Intervention Trial Follow-up Data Interview Clinical Examination Urine Blood & Tumor Tissue (for Cases) Case-cohort & Nested Case-control Studies Main Cohort Study
Cross-sectional and Case-control Analysis of Arsenic Exposure and Risk of Arsenic-induced Skin Lesion
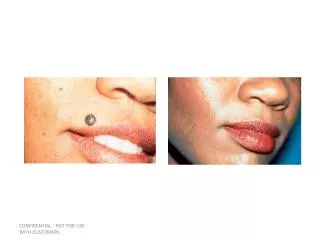
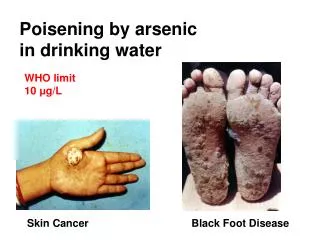
Arsenic induced skin lesions • Hallmark of arsenic poisoning • Short latency, 6 mos to 10 yrs • Precursors of arsenic-related basal/squamous cell skin cancer • Four grades : melanosis -> spotted keratosis on palms/soles->diffuse keratosis on palms/soles->dorsal keratosis (Saha, 2003).
Cross-sectional and Case-control Analysis of the Baseline Data • Cross-sectional analysis • Comparison of 714 skin lesion cases and 10,724 non-cases • Dose-response relationship • Influences of lifestyle factors • Case-control analysis • Comparison of 600 skin lesion cases and 1000 controls • Influences of genetic factors • Influences of urinary As metabolites profile • Analysis methods • Logistic regression with generalized estimating equations (GEE)Adjusted prevalence odds ratios (PORs) and odds ratios (ORs)
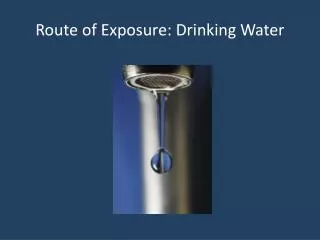
Measurements of Arsenic Exposure • Well arsenic concentration (µg /l) • Measured in water samples from 5,966 wells by graphite furnace atomic absorption (GFAA) • water samples < 5 µg/L were reanalyzed by ICP-MS • Urinary arsenic concentration (µg /l) • Measured in spot samples of urine by GFAA, a detection limit of 1 mg/l • Cumulative arsenic index (CAI) • Function of duration of well usage in years, water consumption per day, and well arsenic concentration. • Example: 5 yrs 100 µg/L for 2L/day • (5*365.25*100*2)/1000 = 365.25 mg • Time-weighted As exposure measure (TWA) • Function of duration of well usage in years and well arsenic concentration. • Example: 5 yrs 100 µg/L and 5 yrs 200 µg/L → 150 µg/L
Relative Excess Risk for Interaction (RERI) • Presence of interaction on the additive scale : (Risk due to both high As and a susceptible factor) > (Risk due to high As) + (Risk due to a susceptible factor) ? ORboth – (ORAs only + ORsusceptible factor only)+1 > 0? RERI, Synergy : RERI > 0 , 95% CI > 0 CIs will be constructed using standard delta method (Hosmer and Lemeshow 1992)
Extension: Dose-specific RERI RERI ≈POR31– (POR30 + POR01) +1 > 0?
Association between Arsenic Exposure and Risk of Skin Lesion
Joint Effect of As Exposure and Low BMI RERI =5.3- (0.8+3.3) + 1 = 2.2 (0.5-3.9) 5.3 (3.1-8.9) Adjusted PORs for skin lesions*** 0.8 (0.4-1.5) 3.3 (1.9-5.8) BMI* 1.0 (Ref) Time-weighted As concentration (µg/L)** Ahsan et al., American Journal of Epidemiology In Press
Joint Effect of As Exposure and Male Gender 18.5 (8.7-39.1) 12.4 (5.8-26.5) 10.4 (4.8-22.2) 7.1 (3.3-15.3) 3.8 (2.0-7.4) Adjusted PORs for skin lesions*** 2.7 (1.2-6.1) 4.7 (2.1-10.2) 2.8 (1.2-6.3) 1.2 (0.5-2.9) 1.0 (Ref) Time-weighted As concentration (µg/L)** Ahsan et al., American Journal of Epidemiology In Press
Distribution of Tobacco Smoking by Gender and Skin Lesion Status
Joint Effect of Arsenic and Tobacco Smoking in Men RERI 1.7 (0.2-3.4)* 5.3 (2.8-10.0) Adjusted PORs for skin lesions*** 1.4 (0.7-2.7) 3.2 (1.5-6.5) 1.0 (Ref) Time-weighted As concentration (µg/L)** Chen Y et al., Epidemiology, In press
Joint Effect of Arsenic and Tobacco Smoking in Women RERI = -0.1 (-4.4-4.2) 5.1 (2.0-13.2) 2.9 (1.0-8.8) Adjusted PORs for skin lesions*** 3.4 (1.7-6.8) 1.0 (Ref) Time-weighted As concentration (µg/L)** Chen Y et al., Epidemiology, In press
Joint Effect of As Exposure and Tobacco Smoking in Men 5.5 (2.8-10.9) RERI = 2.8 (0.1-5.6)* 6.3 (3.1-13.0) Adjusted PORs for skin lesions*** 1.3 (0.6-2.9) RERI = 2.0 (0.1-4.0)* 1.4 (0.7-2.7) 3.2 (1.5-6.5) 1.0 (Ref) Time-weighted As concentration (µg/L)** Chen Y et al., Epidemiology, In press
Distribution of Fertilizer and Pesticide Use by Gender and Skin Lesion Status
Joint Effect of As Exposure and Fertilizer use in Men RERI = 1.3 (-0.2-2.9) RERI = 1.0 (-0.2-2.2) 5.3 (3.1-9.1) 3.7 (2.2-6.4) Adjusted PORs for skin lesions*** 1.5 (0.8-2.6) 3.5 (2.1-6.1) 2.3 (1.3-4.0) Ever use of Fertilizer 1.0 (Ref) Time-weighted As concentration (µg/L)** Chen Y et al., Epidemiology, In press
Joint Effect of As Exposure and Pesticide use in Men 2.3 (1.4-3.5) 3.7 (2.4-5.6) Adjusted PORs for skin lesions*** 1.0 (0.7-1.7) 3.0 (2.0-4.6) 3.7 (2.4-5.7) Ever use of Pesticide 1.0 (Ref) Time-weighted As concentration (µg/L)** **As categories were based on quintiles in the overall ***PORs were adjusted for age, gender, BMI, and smoking status. Chen Y et al., Epidemiology, In press
Joint Effect of As and Excessive Sun Exposure in Men 5.3 (3.0-9.3) 4.5 (2.6-7.8) 2.0 (1.0-3.9) Adjusted PORs for skin lesions*** 3.8 (2.8-5.1) Work outside uncoverred 2.5 (1.9-3.5) 1.0 (Ref) Time-weighted As concentration (µg/L)** **As categories were based on quintiles in the overall ***PORs were adjusted for age, gender, BMI, and smoking status. Chen Y et al., Epidemiology, In press
Summary • Consistent dose-response relationships were found between As exposure and risk of skin lesions. • Male and/or thinner participants were more likely to be affected by As exposure. • Use of fertilizer and excessive sun exposure increase the susceptibility to risk of skin lesions due to As exposure. • Tobacco smoking and high level of As exposure synergistically increase the risk of skin lesions.
Influence of Genetics Factors and Urinary As Metabolites Profile
Metabolism of Arsenic InAsV GSH InAsIII SAM SAH MMAV GSH MMAIII SAM SAH DMAV (SAM) MTHFR (Vitamin B2-dependent enzyme) (SAH)
Methods • Case control analysis of 594 cases of prevalent skin lesions and 1041 controls randomly selected from non-cases. • Urinary arsenic metabolites were speciated using a method by Heitkemper that employs HPLC separation of arsenobetaine (AsB), arsenocholine (AsC), As (III), As (V), MMA and DMA, followed by ICP-MS analysis. • Genotyping of SNPs in MTHFR and GSTO1 genes was performed using fluorescence polarization technique. 10% of samples were duplicated after re-labeling. • Haplotype pairs (diplotypes) were constructed using PHASE version 2.1 which is based on Bayesian statistical method.
Associations of Risk of Skin lesions with Urinary As Metabolites Ahsan et al., in preparation
Relationship between MTHFR Genotypes and Risk of Skin Lesions Ahsan et al., in preparation
Joint Effect of As and MTHFR 677C→T Genotype 6.8 (1.5 - 30.5) 1.3 (0.4-4.3) Adjusted PORs for skin lesions*** 2.7 (1.7- 4.1) 1.1 (0.8-1.7) MTHFR (677 C/T mutation) 2.1 (1.6-2.7) 1.0 (Ref) Time-weighted As concentration (µg/L)** Ahsan et al., in preparation
Joint Effect of As and MTHFR 1298A→C Genotype 2.8 (1.8-4.3) 1.4 (0.9-2.1) 2.2 (1.5-3.4) Adjusted PORs for skin lesions*** 1.0 (0.6-1.5) 2.1 (1.2-3.7) MTHFR (1298 C/A mutation) 1.0 (Ref) Time-weighted As concentration (µg/L)** Ahsan et al., in preparation
Joint Effect of As and MTHFR Haplotype Pairs Ahsan et al., in preparation
Relationship between GSTO1 Genotypes and Risk of Skin Lesions
Joint Effect of As and GSTO1 Genotypes 3.4 (1.3-8.9)) 2.0 (0.8-4.9) 2.3 (1.6-3.4) Adjusted PORs for skin lesions*** 0.9 (0.6-1.4) 2.1 (1.5-2.8) GSTO1 rs# 4925 1.0 (Ref) Time-weighted As concentration (µg/L)** Ahsan et al., in preparation
Joint Effect of As and GSTO1 Genotypes 2.6 (0.7-9.4) 1.2 (0.3-4.4) 2.4 (0.6-9.4) Adjusted PORs for skin lesions*** 1.2 (0.3-4.0) GSTO1 rs# 11509438 1.0 (Ref) 0.4 (0.1-4.8) Time-weighted As concentration (µg/L)** Ahsan et al., in preparation
Joint Effect of As and GSTO1 Genotypes 3.0 (0.8-12.3) 1.4 (0.4-5.8) 3.0 (0.7-12.7) Adjusted PORs for skin lesions*** 1.0 (0.2-4.4) GSTO1 rs# 11509437l 1.0 (Ref) 0.5 (0.03-5.9) Time-weighted As concentration (µg/L)** Ahsan et al., in preparation
Joint Effect of As and GSTO1 Haplotype Pairs Ahsan et al., in preparation
Other Genes of Interest • Oxidative Stress Genes • Myeloperoxidase (MPO) • Catalase (CAT) • Glutathione Peroxidase (GPX1) • Manganese Superoxide Dismutase (MnSOD) • DNA Repair Genes • 8-hydroxyguanine DNA Glycosylase (OGG1) • X-ray Repair Cross-complementing Protein 1 (XRCC1) • X-ray Repair Cross-complementing Protein 3 (XRCC3) • Xeroderma Pigmentosum of Complementation Group D (XPD) • DNA Ligase I (LIG1) • DNA ligase IV (LIG4)
Summary • Genes such as MTHFR and GSTO1 responsible for methylation of As can modulate As metabolism and also its health effects.
Interaction between Se and As • Metabolic interaction • As promotesbiliary excretion of Se,and vice versa • Detection of seleno-bis(S-glutathionyl) arsinium ion [(GS)2AsSe]-in bile (Gailer 2000). • Direct interaction/precipitation • Biologically antagonistic to each other • Insoluble selenide (As2Se) deposits in lysosomes. Zeng et al, 2005
Advantage of A Case-Cohort Study Design • Direct calculation of a risk ratio without the collection of full information on every member of a cohort.
Selection of Study Population for the Case-cohort study HEALS Cohort 11,746 participants 9,727 both urine/blood samples, clinical examination 712 prevalent skin lesion cases A random sample of 923 were used for genetics study; blood was used up. 8092 free of skin lesions 303 were taken as the case series Baseline Follow-up 11% 31 incident cases identified at follow-up 1, part of the 303 Subcohort 850 Follow-up
Measurements of Baseline As and Se • Blood As and Se • In whole blood, by ELAN DRC II inductively coupled plasma-mass spectrometry (ICP-MS) equipped with AS 93plus Autosampler (Perkin Elmer, Norwalk, CT) • Blood Se is a indicator of long-term selenium intake (Willett WC 1996) • Water As • by graphite furnace atomic absorption (GFAA) • water samples < 5 µg/L were reanalyzed by ICP-MS • Total urinary As • by GFAA, a detection limit of 1 mg/l