Download
1 / 34
340 likes | 343 Views
8 TH ASIA-PACIFIC GAW WORKSHOP ON GREENHOUSE GASES 17 - 21 October 2016 Seoul, Republic of Korea. THE OZONE MONITORING ACTIVITIES AND ITS TREND ANALYSIS IN MALAYSIA DURING EL NIÑO AND LA NIÑA PHENOMENA. Maznorizan Mohamad Director Atmospheric Science Division

E N D
8TH ASIA-PACIFIC GAW WORKSHOP ON GREENHOUSE GASES 17 - 21 October 2016 Seoul, Republic of Korea THE OZONE MONITORING ACTIVITIES AND ITS TREND ANALYSIS IN MALAYSIA DURING EL NIÑO AND LA NIÑA PHENOMENA Maznorizan Mohamad Director Atmospheric Science Division Malaysian Meteorological Department
Introduction The Ozone Monitoring Activities Analysis, Results & Discussions Conclusion Future Plan Scope
Introduction • The ozone monitoring activities in Malaysia has started since October 1992, participating in the WMO GO3OS network with the launching and establishment of Malaysian Meteorological Department’s (MetMalaysia) ozone monitoring programme that includes surface ozone, ozone vertical distribution as well as total column ozone monitoring. • As a developing nation, it is important for Malaysia to take part in global initiative to achieve a better understanding of the inadvertent atmospheric changes and their effects on the ecosystem and life on earth, that links to the ozone depletion.
Introduction • Surface ozone is considered as bad ozone, that contribute to global warming. • At stratospheric level, it is the strong absorption of the solar radiation in the UV wavelength by the stratospheric ozone which provides shield that protects life on the earth surface from the harmful UV radiation.
Introduction • Since El Niño and La Niña is one of the significant and complex weather phenomena that occur within 2 to 7 years cycle: → important to look into the effect of either El Niño or La Niña has on the ozone data concentration over the region especially over Malaysia. • Observation and analysis of ozone data provide important information with regard to the trend of ozone composition in the atmosphere which is beneficial to the policy makers who are dealing with the environmental issues, planning and policy.
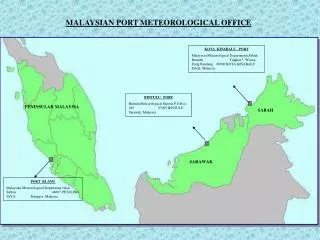
The Ozone Monitoring Activities in Malaysia • MetMalaysia has established the ozone monitoring activities in the western and central part of Peninsular Malaysia as well as in the eastern part of Sabah. • The locality of the monitoring sites represent the station in the equatorial tropical region. • In general, Malaysia’s climate is influenced by the dry period during the southwest monsoon (summer monsoon) and wetter period during Northeast Monsoon (winter Monsoon).
The Ozone Monitoring Activities • Surface Ozone • Surface Ozone Analyzer • Location: • Cameron Highlands GAW Regional Station since 1997 (only this station is discussed) • Danum Valley GAW Global Station since 2007 • Total Column Ozone • The total amount of ozone in a vertical column from the surface to the edge of the atmosphere • Brewer Mark II Spectrophotometer • Location: • Petaling Jaya GAW Regional Station since 1992
The Ozone Monitoring Activities • Vertical Ozone Profile • Recorded by releasing the ECC type ozonesonde twice a month to probe the atmosphere • Location: • Petaling Jaya GAW Regional Station from 1991 - 1998 • Sepang Kuala Lumpur International Airport (KLIA) GAW Regional Station since 1998 (only this station is discussed)
Monitoring Instrument Surface Ozone Analyzer Thermo 49i Ozone Analyzer Thermo 49i-PS Ozone Primary Standard • Use UV photometric technology to measure the amount of ozone in the air from ppb levels up to 200ppm. • Operates on the principle that ozone (O3) molecules absorb UV light at a wavelength of 254 nm. • The degree to which the UV light is absorbed is directly related to the ozone concentration
Monitoring Instrument Brewer Spectrophotometer Brewer Mark II Spectrophotometer • Fully automatic instrument used to measure the amount of ozone in the atmospheric column and the amount of UV-B irradiance from the sun. • Measures ultraviolet radiation in the solar spectrum at five selected wavelengths, where the ozone has strong and variable absorption. • The relation between the variations of the ozone in different pairs of the wavelength is used to calculate the concentration of the ozone.
Monitoring Instrument Ozonesonde Ozonesonde • Attached to a large hydrogen filled balloon which is released into the upper atmosphere, up to an altitude of 30 – 35 km. • Contains a small pump driven by a battery which draws air through a chamber containing electrodes in an aqueous potassium iodide solution. • The amount of ozone in the air is measured using electrochemical effect, and the information is transmitted to a ground receiver.
Analysis, Results & Discussions • Surface Ozone • Total Column Ozone • Vertical Ozone Profile The study is conducted to investigate the O3 distributionfrom 1995 - 2015 in several locations in Malaysia.
Time Series Analysis Surface Ozone The Monthly Average of Surface Ozone & Ocean Niño Index (ONI) at Cameron Highlands & Mauna Loa (1995-2015)
Analysis Results Surface Ozone • The monthly average concentration of surface O3 in Cameron Highlands (1995-2015) is generally less than the monthly average concentration of surface O3 in Mauna Loa. • For Cameron Highlands, the concentration fluctuated between 1 - 40 ppb, while for Mauna Loa, the concentration recorded are higher with values fluctuated between 20 - 60 ppb. • The two highest monthly average of surface ozone at Cameron Highlands were 39.69 ppb and 39.45 ppb and were observed in September 1997 and October 2015 respectively and this coincides with the period of strong El Niño event experienced in the tropical region.
Surface Ozone ..cont. • During extensive La Niña phase (from June 1998 to April 2001), it can be identified that the trend of surface ozone is proportionally correlated with the ONI values. • During short period of La Niña event and neutral phase, no significant correlation can be detected. • For the past 20 years (1995 – 2015), both stations in Cameron Highlands and Mauna Loa are not showing any significant changes of the surface ozone trend.
Time Series AnalysisTotal Column Ozone (TCO) The Monthly Average of Total Column Ozone and ONI at Petaling Jaya (1995-2016)
Analysis Results Total Column Ozone (TCO) • From Jan 1995 to May 2016, TCO fluctuated at irregular cycle especially during weak El Niño/La Niña and Neutral phase, but during strong El Niño (1997 & 2015), the patterns were closely corresponded to the strength of the El Niño. • The observed monthly average of total column ozone in Petaling Jaya indicates the highest reading was recorded in September 1997 (286.5 DU) and November 2015 (300.7 DU), which was during strongest El Niño recorded in decades. • The analysis shows that for the long term record of nearly 20 years, the overall trend line was showing a slight decrease for the TCO over the area.
Total Column Ozone (TCO) ..cont. The Monthly Average of Total Column Ozone at Petaling Jaya during Northeast Monsoon – Dec,Jan,Feb(1996 – 2016) The Monthly Average of Total Column Ozone at Petaling Jaya during Southwest Monsoon - June, Jul, Aug (1995 – 2016)
Total Column Ozone (TCO) ..cont. The Monthly Average of Total Column Ozone at Petaling Jaya during Inter Monsoon I (April-May) (1995 – 2016) The Monthly Average of Total Column Ozone at Petaling Jaya during Inter Monsoon II (Sept- Oct) (1996 – 2016)
Analysis Results Total Column Ozone (TCO) ..cont. • During the Northeast Monsoon, the highest TCO recorded is 265 DU while the lowest is 231 DU, whereas, during the Southwest Monsoon, the highest TCO recorded is 285 DU and the lowest value recorded is 247 DU. • It is clearly indicated that the TCO increases during dry period (SW monsoon) and decreases during the wet period (NE monsoon). • As observed during inter monsoon l, the value of TCO ranged from 250-285 DU, and during inter monsoon II, it ranged from 244- 286 DU. • It can be concluded that for both inter monsoon, the value of TCO is quite consistent and almost within the same range.
Vertical Ozone Profile The SHADOZ Network • The vertical ozone profile monitoring activities are conducted at the Sepang KLIA station. • This station is also one of the contributing station for the South Hemispheric Additional Ozonesondes (SHADOZ) network. • The analysis is done using 18 years of observation data from 1998 to 2015. Operationally, the ozonesondes are launched twice a month, during the early and middle of the month.
Analysis Results Vertical Ozone Profile Vertical ozone profiles during the strong El Niño (Feb.2015 – June 2016), moderate La Niña (June 1998 – April 2001) two neutral periods (April 2001 – May 2002) & (April 2012 – Dec 2014)
Vertical Ozone Profile ..cont. Vertical ozone profiles during the strong El Niño (Feb.2015 – June 2016), moderate La Niña (June 1998 – April 2001) two neutral periods (April 2001 – May 2002) & (April 2012 – Dec 2014), analyzed from the surface up until 18 km
Vertical Ozone Profile ..cont. • The vertical ozone profiles are showing the mean ozone concentration at all altitudes for all the launches during the respective events. • It is observed that the pattern of ozone profiles did not vary significantly during the selected El Niño and La Niña event, as well as during neutral years. • The profiles follow and agreeable with the pattern of the standard global ozone vertical profiles which clearly determined the maximum ozone concentration are within the stratospheric levels.
Vertical Ozone Profile ..cont. • The stratospheric ozone concentration during moderate La Niña event reached the maximum mean value of 9.0 ppmv at the height of 29 – 30 km. While, the stratospheric ozone concentration during strong El Niño event reached the maximum mean value of 8.5 ppmv at the height of 30 – 31 km. • During the two neutral periods, the mean maximum values were around 8.6 ppmv at altitudes between 29.9 – 30.9 km.
Vertical Ozone Profile ..cont. • The troposheric ozone concentration during strong El Niño event is slightly higher than in moderate La Niña event at the troposheric layer (up until 15 – 16 km) and the situation is reversed once entering the stratospheric layer. • It can be summarized that over Peninsular Malaysia, the maximum stratospheric ozone is ranged between 8.5 – 9.0 ppmv at the stratospheric layer of between 29 – 31 km.
Conclusion • The monthly average concentration of surface O3 in Cameron Highlands (1995-2015) is generally less than the monthly average concentration of surface O3 in Mauna Loa, Hawaii (global reference). • Surface O3 concentration is also observed to be influenced by the strong El Niño phenomena where the highest surface concentration were recorded during these events, while during weak El Niño, La Niña and neutral phase, the values fluctuate within the monthly average range. • The observed monthly average of total column ozone in Petaling Jaya recorded the highest reading in September 1997 (286.5 DU) and November 2015 (300.7 DU) which was during strongest El Niño event.
Conclusion • This study also concludes that during dry period which is during southwest monsoon, the TCO increased, while during the wet period (northeast monsoon), the value of TCO decreased significantly. • While, during inter monsoon l and II, the value of TCO is quite consistent and almost within the same range. • The maximum stratospheric ozone is within the range of 8.5 to 9 ppmv and is found at the stratospheric layer ranged from 29 to 31 km above ground.
Future Plan • Since the government of Malaysia acknowledges the importance of ozone monitoring, MetMalaysia was given enough allocation to acquire 6 units of total column ozone monitoring instrument under the 11th Malaysia Plan. • With the installation of 6 units of Brewer Spectrophotometer in early 2017, Malaysia will be able to monitor near real time total column ozone as well as other parameter such as UV radiation and AOD all over the country and the distribution of these parameters can be mapped. • Before 2020, MetMalaysia is planning to acquire 4 units of CO2 and CH4 Analyzer to be installed in northern and central part of Peninsular as well as in Sabah and Sarawak.
Surface Ozone Trendline The Monthly Average of Surface Ozone at Cameron Highlands & Mauna Loa (1995-2015)
Total Column Ozone Trendline The Monthly Average of Total Column Ozone at Petaling Jaya (1995-2016)