Download
1 / 38
380 likes | 431 Views
SEG5010 Presentation. Zhou Lanjun. A graph-based approach to systematically reconstruct human transcriptional regulatory modules. Xifeng Yan et al. ISMB 2007. Problem. Gene regulation

E N D
SEG5010 Presentation Zhou Lanjun
A graph-based approach to systematically reconstruct human transcriptional regulatory modules Xifeng Yan et al. ISMB 2007 SEG5010 Presentation
Problem • Gene regulation • includes the processes that cells and viruses use to turn the information in genes into gene products. (Wikipedia) • Commonly approach • Derive coexpression clusters from a microarray dataset (http://en.wikipedia.org/wiki/DNA_microarray ) • Mining coexpression clusters from multiple microarray datasets across diverse conditions are more likely to form a transcription module ? SEG5010 Presentation
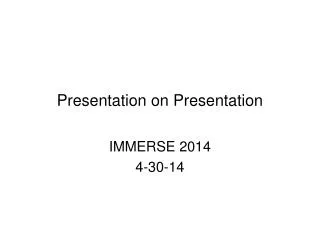
Problem • Mining frequent dense vertexset (FDVS) The vertex set {d, e, f, g} is a frequent dense vertexset because >80% of the vertex pairs are connected in at least 2 out of the 4 graphs (thick lines) SEG5010 Presentation
Problem • Why not directly use the summary graph? • One of the two dense subgraphs in the summary graph, {a, b, c, d}, is not dense in any original graph. • Noise may become indistinguishable SEG5010 Presentation
Problem Formulation SEG5010 Presentation
Problem Formulation SEG5010 Presentation
Mining frequent dense vertexsets • Important Observation: • Given m graphs, a frequent dense vertexset with density δ and frequency θ must form a subgraph with density >= δθmin the summary graph. • We can start from the summary graph and mine its dense subgraphs first SEG5010 Presentation
Mining frequent dense vertexsets cont’d SEG5010 Presentation
Mining frequent dense vertexsets cont’d • Benefits • Significantly shrink the search space • Provide a good starting point for the refinement process • Defects • False patterns • Fail in splitting largeinfrequent dense vertexsets • Might break a true densevertexset in half SEG5010 Presentation
Mining frequent dense vertexsets cont’d • Discussion of noise tolerant • G' : noise graph • G* : real graph • G : observed graph • The chance for a noise edge to have weight >=θm in a summary graph is: SEG5010 Presentation
Mining frequent dense vertexsets cont’d • The expected number of k-vertex dense subgraphs that could be formed by noise edges: • p=b(m,θ,q) • s= k(k−1)/2 • P(k,l,d) : the probability that a k-vertex l-edge graph has minimum degree d (derived through simulation) Very sensitive to p SEG5010 Presentation
Mining frequent dense vertexsets cont’d • Solutions: • Divide the coexpression graphs into small groups (reduce m) • Re-weight summary graph to reduce the weights of noise edges SEG5010 Presentation
Pipeline of NeMo SEG5010 Presentation
Partitioning • Group together graphs that likely contain at least one FDVS. SEG5010 Presentation
Re-weight edges in summary graph • Traditional summary graph • w : the number of edges shared by the two vertices across m graphs • Proposed method : ‘neighbor association’ summary graph • Intuition: if two vertices share many small frequent dense subgraphs, likely these two vertices come from the same dense vertexset SEG5010 Presentation
Re-weight edges in summary graph (cont’d) • Graphlets • There is a connection between the density of a graph and its k-graphlets SEG5010 Presentation
Re-weight edges in summary graph (cont’d) • Let score(u,v) be the weight of edge(u,v) in a neighbor association graph. • If u and v are in the same dense subgraph, score(u,v) should be close to 1 • If u and v are not in the same dense subgraph, score(u,v) should be smaller • If u and v do not share any dense k-graphlet, score(u,v) should be set to 0 SEG5010 Presentation
Re-weight edges in summary graph (cont’d) • Given two vertices, u and v in a large clique with n vertices, the maximum number of k-graphlets they share is , after normalization this value is: • When n >> k, (4) is close to 1 SEG5010 Presentation
Re-weight edges in summary graph (cont’d) • Let πu be the set of frequent dense (k −1)-vertexlets that contain vertex u and πu,v be the set of frequent dense k-vertexlets that contain u and v. Define: • Note : score(u,v) is not equal to score(v,u) SEG5010 Presentation
Re-weight edges in summary graph (cont’d) SEG5010 Presentation
Experiment Setup • 105 human microarray datasets • An edge exists between two genes if their expression correlation with a p-value less than 0.01 significant (Zhou et al., 2002) • Top 2% (justified by Equation 2) most significant correlations with a p-value less than 0.01 are included in each graph in this study SEG5010 Presentation
Experimental results SEG5010 Presentation
Comparison with other approaches SEG5010 Presentation
Comparison with other approaches SEG5010 Presentation
Conclusions • A novel graph-based algorithm, NeMo, to efficiently mine the frequent dense vertexsets in a set of coexpression graphs. • Demonstration of NeMo’s application in identifying frequent coexpression clusters across many microarray datasets • NeMo can also be applied to other biological relational graphs for finding approximate network modules. SEG5010 Presentation
Conserved pathways within bacteria and yeast as revealed by global protein network alignment Brian P. Kelley et al. PNAS2003, Vol. 100, no. 20 SEG5010 Presentation
Concepts • Pathway • Refers to a sequence of protein–protein interactions forming a connected path in the network SEG5010 Presentation
Problem • Given that protein sequences and structures are conserved in and among species, are networks of protein interactions conserved as well? • Is there some minimal set of interaction pathways required for all species? • Can we measure evolutionary distance at the level of network connectivity rather than at the level of DNA or protein sequence? Mounting evidence suggests that conserved protein interaction pathways indeed exist and may be ubiquitous SEG5010 Presentation
Method • An efficient computational procedure for aligning two protein interaction networks to identify their conserved interaction pathways.(PATHBLAST) SEG5010 Presentation
Overview of The PATHBLAST Algorithm • Two networks are combined into a global alignment graph • Vertex: a pair of proteins (one from each) having at least weak sequence similarity (BLAST E<=10-2) • Edge: Conserved interaction SEG5010 Presentation
BLAST • BLAST is one of the most widely used bioinformatics programs, because it addresses a fundamental problem and the algorithm emphasizes speed over sensitivity. • Which bacterial species have a protein that is related in lineage to a certain protein with known amino-acid sequence? • Where does a certain sequence of DNA originate? • What other genes encode proteins that exhibit structures or motifs such as ones that have just been determined? SEG5010 Presentation
The PATHBLAST Algorithm cont’d • Scoring function of a path P: • p(v) : probability of true homology with in the protein pair represented by v • q(e): probability that the protein-protein interactions represented by e are real • prandom and qrandom : expected values of p(v) and q(e) overall vertices and edges in G SEG5010 Presentation
The PATHBLAST Algorithm cont’d • p(v) is computed using Bayes’ rule • H : the event of true homology between the proteins represented by v • p(Ev): the frequency of each E value over all v in G • p(Ev|H): based on E values within the subset of vertices for which both proteins are in the same cluster of orthologous groups (COG) • p(H) : overall frequency of vertices with proteins that are in the same COG SEG5010 Presentation
The PATHBLAST Algorithm cont’d • q(e) of each edge is computed from the underlying probabilities of protein-protein interactions it represents. • This paper estimate q(e) using the number of independent experimental studies reporting it and then compute as the product of these probabilities SEG5010 Presentation
The PATHBLAST Algorithm cont’d • Alignment Procedure • Identify the highest-scoring pathway alignment P* of fixed length L (L vertices and L−1 edges) • If G is directed and acyclic, can be accomplished in linear time by using DP • Base case is: SEG5010 Presentation
The PATHBLAST Algorithm cont’d • Unfortunately, G is not generally acyclic • Construct a sufficient number of directed acyclic subgraphs (5L!) then compute highest-scoring paths for each SEG5010 Presentation
Thanks! Q&A SEG5010 Presentation