Download
1 / 1
10 likes | 98 Views
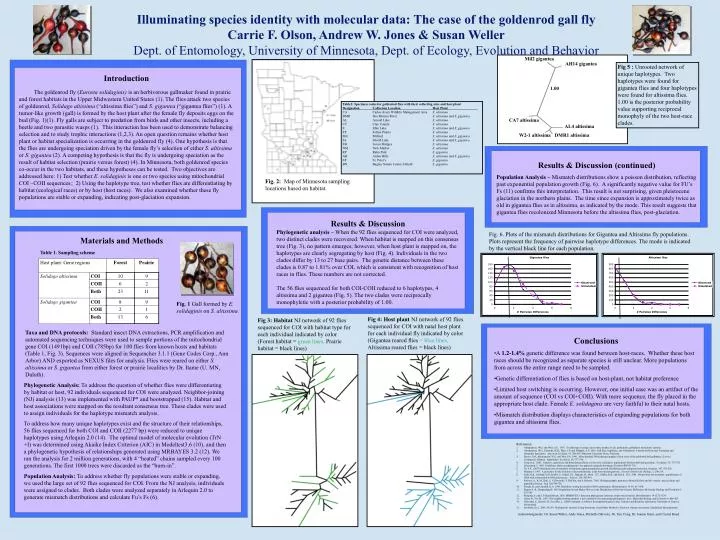
Table2: Specimen codes for goldenrod flies with their collecting sites and host plant Designation Collection Location Host Plant CA Carlos Avery Wildlife Management Area S. altissima DMR Des Moines River S. altissima and S. gigantea AL Arnold Lake S. altissima

E N D
Table2: Specimen codes for goldenrod flies with their collecting sites and host plant Designation Collection Location Host Plant CA Carlos Avery Wildlife Management Area S. altissima DMR Des Moines River S. altissima and S. gigantea AL Arnold Lake S. altissima CC Clay County S. altissima E Elko Lake S. altissima and S. gigantea FP Felton Prairie S. altissima Mil Milford S. altissima and S. gigantea SL Shield Lake S. altissima and S. gigantea SB Seven Bridges S. altissima NM New Market S. altissima RP Rahn Park S. gigantea AH Arden Hills S. altissima and S. gigantea SP St. Peter’s S. gigantea BN Bagley Nature Center, Duluth S. gigantea Illuminating species identity with molecular data: The case of the goldenrod gall flyCarrie F. Olson, Andrew W. Jones & Susan WellerDept. of Entomology, University of Minnesota, Dept. of Ecology, Evolution and Behavior Mil2 gigantea AH14 gigantea Fig 5 : Unrooted network of unique haplotypes. Two haplotypes were found for gigantea flies and four haplotypes were found for altissima flies. 1.00 is the posterior probability value supporting reciprocal monophyly of the two host-race clades. Introduction The goldenrod fly (Eurosta solidaginis) is an herbivorous gallmaker found in prairie and forest habitats in the Upper Midwestern United States (1). The flies attack two species of goldenrod, Solidago altissima (“altissima flies”) and S. gigantea (“gigantea flies”)(1). A tumor-like growth (gall) is formed by the host plant after the female fly deposits eggs on the bud (Fig. 1)(1). Fly galls are subject to predation from birds and other insects, including a beetle and two parasitic wasps (1). This interaction has been used to demonstrate balancing selection and to study trophic interactions (1,2,3). An open question remains whether host plant or habitat specialization is occurring in the goldenrod fly (4). One hypothesis is that the flies are undergoing speciation driven by the female fly’s selection of either S. altissima or S. gigantea (2). A competing hypothesis is that the fly is undergoing speciation as the result of habitat selection (prairie versus forest) (4). In Minnesota, both goldenrod species co-occur in the two habitats, and these hypotheses can be tested. Two objectives are addressed here: 1) Test whether E. solidaginis is one or two species using mitochondrial COI –COII sequences; 2) Using the haplotype tree, test whether flies are differentiating by habitat (ecological races) or by host (host races). We also examined whether these fly populations are stable or expanding, indicating post-glaciation expansion. 1.00 CA7 altissima AL4 altissima W2-1 altissima DMR1 altissima Results & Discussion (continued) Population Analysis – Mismatch distributions show a poisson distribution, reflecting past exponential population growth (Fig. 6). A significantly negative value for FU’s Fs (11) confirms this interpretation. This result is not surprising, given pleistocene glaciation in the northern plains. The time since expansion is approximately twice as old in gigantea flies as in altissima, as indicated by the mode. This result suggests that gigantea flies recolonized Minnesota before the altissima flies, post-glaciation. Fig. 2: Map of Minnesota sampling locations based on habitat. Results & Discussion Phylogenetic analysis – When the 92 flies sequenced for COI were analyzed, two distinct clades were recovered. When habitat is mapped on this consensus tree (Fig. 3), no pattern emerges; however, when host plant is mapped on, the haplotypes are clearly segregating by host (Fig. 4). Individuals in the two clades differ by 13 to 27 base pairs. The genetic distance between these clades is 0.87 to 1.81% over COI, which is consistent with recognition of host races in flies. These numbers are not corrected. The 56 flies sequenced for both COI-COII reduced to 6 haplotypes, 4 altissima and 2 gigantea (Fig. 5). The two clades were reciprocally monophyletic with a posterior probability of 1.00. Fig. 6. Plots of the mismatch distributions for Gigantea and Altissima fly populations. Plots represent the frequency of pairwise haplotype differences. The mode is indicated by the vertical black line for each population. Materials and Methods Table 1. Sampling scheme Fig. 1 Gall formed by E. solidaginis on S. altissima. Fig 4: Host plant NJ network of 92 flies sequenced for COI with natal host plant for each individual fly indicated by color (Gigantea reared flies = blue lines, Altissima reared flies = black lines) Fig 3: Habitat NJ network of 92 flies sequenced for COI with habitat type for each individual indicated by color (Forest habitat= green lines, Prairie habitat = black lines) Taxa and DNA protocols: Standard insect DNA extractions, PCR amplification and automated sequencing techniques were used to sample portions of the mitochondrial gene COI (1491bp) and COII (785bp) for 100 flies from known hosts and habitats (Table 1, Fig. 3). Sequences were aligned in Sequencher 3.1.1 (Gene Codes Corp., Ann Arbor) AND exported as NEXUS files for analysis. Flies were reared on either S. altissima or S. gigantea from either forest or prairie localities by Dr. Itame (U. MN, Duluth). • Conclusions • A 1.2-1.4% genetic difference was found between host-races. Whether these host races should be recognized as separate species is still unclear. More populations from across the entire range need to be sampled. • Genetic differentiation of flies is based on host-plant, not habitat preference • Limited host switching is occurring. However, one initial case was an artifact of the amount of sequence (COI vs COI+COII). With more sequence, the fly placed in the appropriate host clade. Female E. solidaginis are very faithful to their natal hosts. • Mismatch distribution displays characteristics of expanding populations for both gigantea and altissima flies. Phylogenetic Analysis: To address the question of whether flies were differentiating by habitat or host, 92 individuals sequenced for COI were analyzed. Neighbor-joining (NJ) analysis (13) was implemented with PAUP* and bootstrapped (15). Habitat and host associations were mapped on the resultant consensus tree. These clades were used to assign individuals for the haplotype mismatch analysis. To address how many unique haplotypes exist and the structure of their relationships, 56 flies sequenced for both COI and COII (2277 bp) were reduced to unique haplotypes using Arlequin 2.0 (14). The optimal model of molecular evolution (TrN +I) was determined using Akaike Index Criterion (AIC) in Modeltest3.6 (10), and then a phylogenetic hypothesis of relationships generated using MRBAYES 3.2 (12). We ran the analysis for 2 million generations, with 4 “heated” chains sampled every 100 generations. The first 1000 trees were discarded as the “burn-in”. Population Analysis:To address whether fly populations were stable or expanding, we used the large set of 92 flies sequenced for COI. From the NJ analysis, individuals were assigned to clades. Both clades were analyzed separately in Arlequin 2.0 to generate mismatch distributions and calculate Fu’s Fs (6). • References: • Abrahamson, W.G. and Weis, A.E. 1997. Evolutionary Ecology across three trophic levels: goldenrods, gallmakers and natural enemies. • Abrahamson, W.G., Eubanks, M.D., Blair, C.P. and Whipple, A.V. 2001. Gall flies, Inquilines, and Goldenrods: A model for Host-race Formation and Sympatric Speciation. American Zoologist, 41, 928-938. Princeton University Press, Princeton. • 3. Brown, J.M., Abrahamson, W.G. and Way, P.A. 1996. Mitochondrial DNA phylogeography of host races of the goldenrod ball gallmaker, Eurosta solidagninis (Diptera: Tephritidae). Evolution, 50, 777-786. • Craig et al. 2001. Genetics, experience and host plant preference in Eurosta solidaginis: implications for host shift and speciation. Evolution 55: 773-782. • Felsenstein, J. 1985. Confidence limits on phylogenies: An approach using the bootstrap. Evolution39:783-791. • Fu, Y.X. (1997) Statistical tests of neutrality of mutations against population growth, hitchhiking and background selection. Genetics, 147, 915-925. • Murmur J. 1961. A procedure for the isolation of deoxyribonucleic acids from microorganisms. Journal of Molecular Biology, 3, 208-218. • Saiki, R.K., Gelfand, D.H, Stoffel, S., Scharf, S.J., Higuchi, R., Horn. G.T., Mullis, K.B. and Erlich. H.A. 1988. Primer-directed enzymatic amplification of DNA with a thermostable DNA polymerase. Science, 239, 487-491. • Pavlova, A., R. M. Zink, S. V. Drovetski, Y. Red’kin, and S. Rohwer. 2003. Phylogeographic patterns in Motacilla flava and M. citreola: species limits and population history. Auk 120:744-758. • Posada, D. and Crandall, K.A. 1998. Modeltest: testing the model of DNA substitution. Bioinformatics 14 (9): 817-818. • Rogers A. R., Harpending H. 1992 Population Growth Makes Waves in the Distribution of Pairwise Genetic Differences Molucular Biology and Evolution 9: 552-569 • Ronquist, F. and J. P. Huelsenbeck. 2003. MRBAYES 3: Bayesian phylogenetic inference under mixed models. Bioinformatics 19:1572-1574 • Saitou N., Nei M., 1987. The neighbor-joining method: a new method for reconstructing phylogenetic trees. Molecular Biology and Evolution 4: 406-425 • Schneider, S., Roessli, D., Excoffier, L. (2000) Arlequin: A software for population genetic data. Genetics and Biometry Laboratory, University of Geneva, Switzerland. • Swofford, D. L. 2000. PAUP*. Phylogenetic Analysis Using Parsimony (*and Other Methods). Version 4. Sinauer Associates, Sunderland, Massachusetts. Acknowledgments: Dr. Susan Weller, Andy Jones, Michelle DaCosta, Dr. Tim Craig, Dr. Joanne Itami, and Crystal Boyd